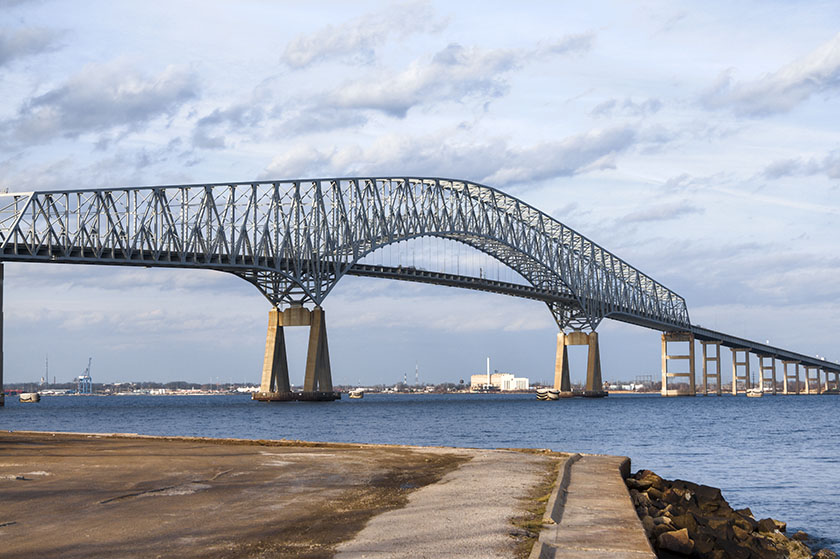
Traffic takeaways: The Baltimore bridge collapse Read article
The big game 🏈 had everyone on the edge of their seats last Sunday, going into overtime and going down in history as the most-watched TV program in the U.S. to date. Afterwards, while everyone was recapping play-by-plays, Team Arity was digging into our massive database to uncover the latest driving trends.
With more than 1.5 trillion miles of driving data collected and analyzed, Arity has a unique view of what’s happening on our roads. Here’s what we saw during the big games in 2022, 2023, and 2024.
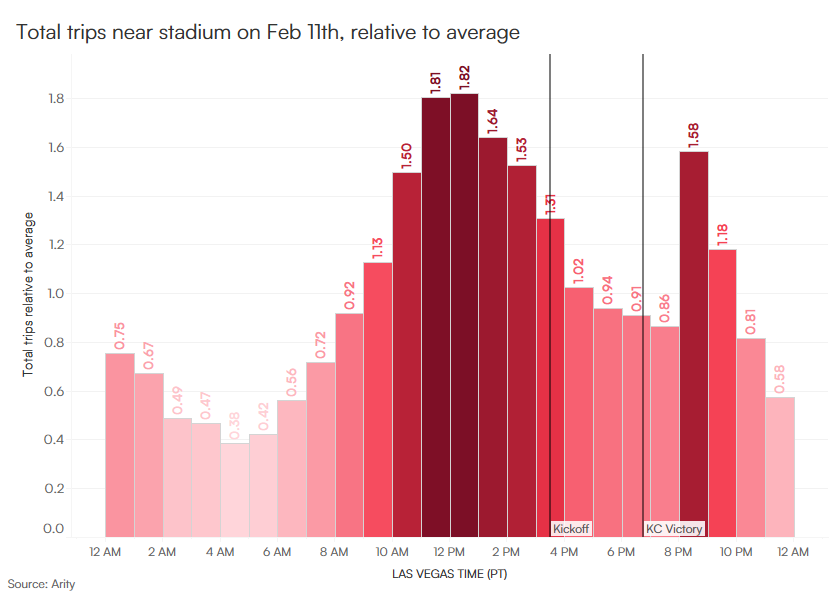
Year over year, the big game sells out stadiums and brings waves of tourists to cities – and this year was no different. In Las Vegas this past weekend, we saw 30% more trips during the big game compared to a “normal” Sunday, and traffic near the stadium was 13% slower with its busiest (and slowest) time period three to four hours before kickoff.
We saw similar trends in 2022 and 2023 with heightened traffic levels on the day of the big game which also peaked a few hours before kickoff.
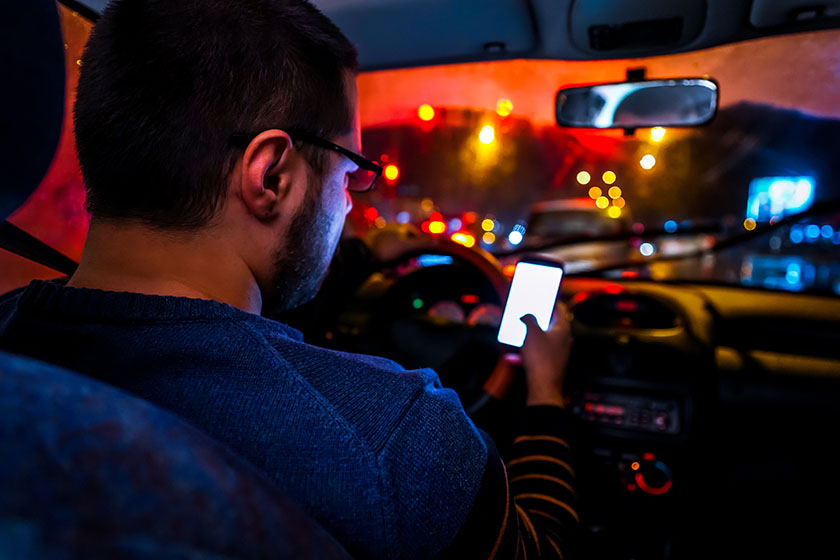
In addition to more people driving near the stadium on the day of the big game, we also see instances of distracted driving. This year, 22% of trips taken near the stadium involved at least one occurrence of phone handling behind the wheel.
While the frequency of this risky driving behavior remained similar to levels we saw on a “normal” Sunday in Las Vegas, it’s actually 8% lower than the big game last year.
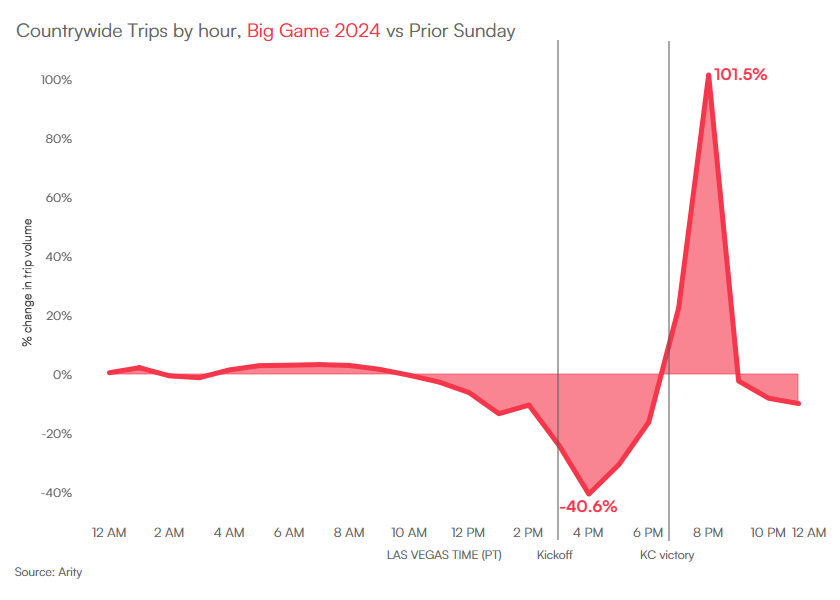
Our driving data reflects the fact that this year’s big game was the most-watched TV program in the U.S., with an average of 123.7 million viewers. We saw the number of drivers on the roads decline countrywide during the program, and then increase significantly after the end of the game.
In fact, trips across the U.S. doubled after the game ended compared to the same time on a “normal” Sunday.
We saw similar day-of traffic patterns the past two years as well, indicating that people tend to stay put – wherever they’re watching from – during the game.
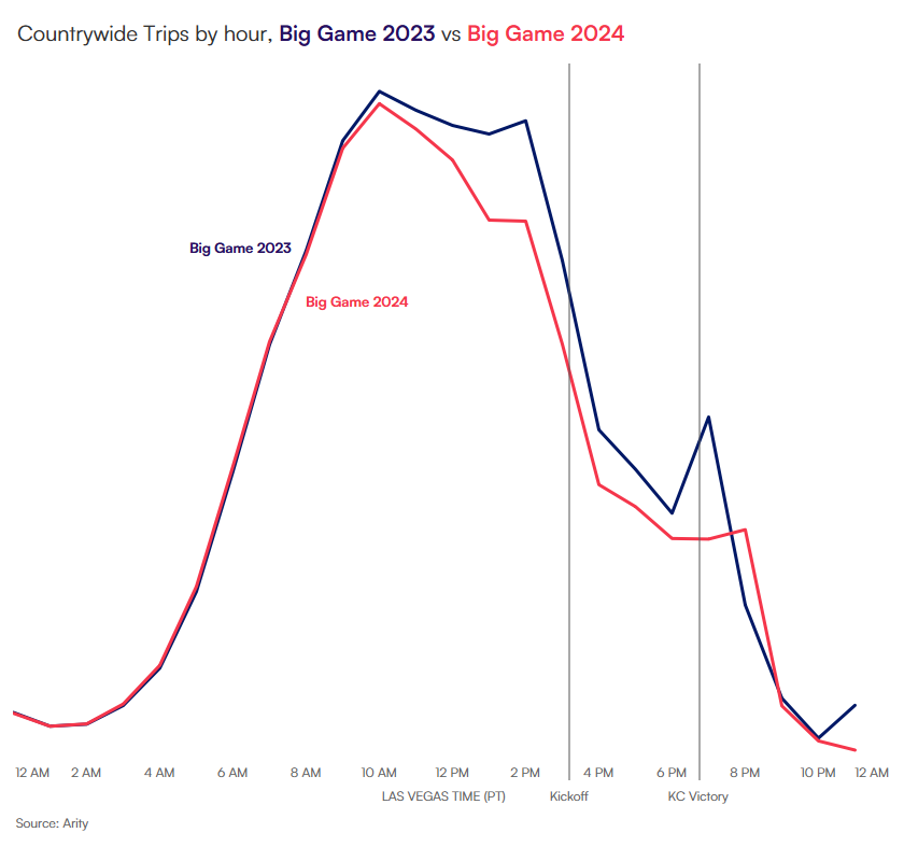
Interestingly, it seems like this year’s big game going into overtime (which has only happened one other time in the league’s history) impacted when people left the place they were watching from.
In 2022 and 2023, there was a clear “spike” as people headed out directly after the end of the game. However, this year, we saw more of a “plateau” as people hit the roads at different points in time – some left later in the game, some in overtime, and some after the end of the game.
Big events like these are bound to disrupt cities’ “normal” traffic and driving behavior patterns. However, driving data can unveil important trends to look out for around these events, so that everyone – drivers, businesses, cities, etc. – can be prepared for those changes.
Check out our President Gary Hallgren’s blog, sharing how we’re using the largest driving behavior database tied to insurance claims to build a smarter, safer, and more useful future of mobility.
Arity’s multi-source dataset with more than 40 million active connections includes anonymized and aggregated driving behavior data collected through consumer mobile apps, insurance telematics, and on-board device (OBD) programs.
Because the data is from multiple insurance and non-insurance sources and is not solely reflective of any Arity affiliate companies or any other particular industry or source, we really get a sense of how people are moving, where they are going, when, and how. Arity is connected to millions of U.S. drivers, so we have a credible representation in every state and demographic (e.g., families, single vehicles, rural, cities).
Keep in mind that although a majority of the trips Arity collects are personal trips, we have the capability to decipher between personal trips, gig driving, and non-driving impacts.
Because Arity collects various driving behaviors within a trip, we also can evaluate trends such as speeding, braking, acceleration, phone handling, and the time of day someone drives. For example, fueled by the largest telematics dataset tied to claims, we can more accurately predict dangerous driving behavior that we described in this report.