A continuing concern: Distracted driving has increased, again Read article

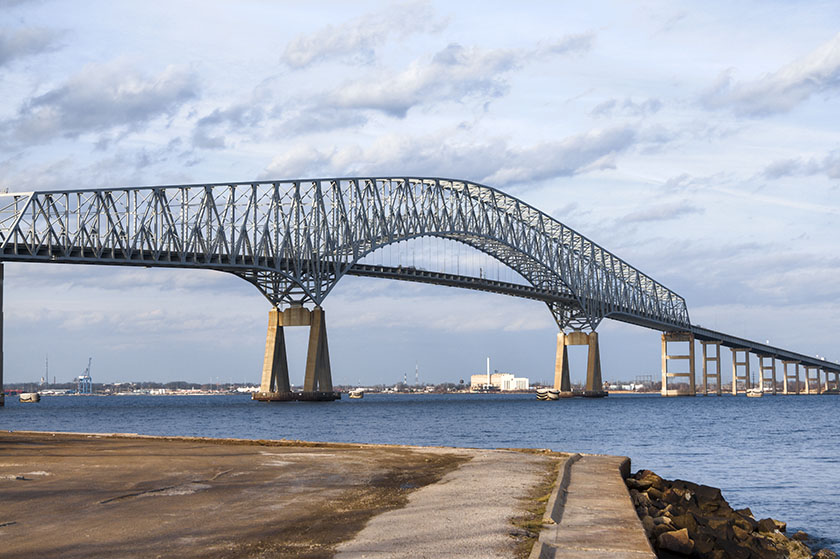
On March 26, a cargo ship struck Baltimore’s Francis Scott Key Bridge, causing a key piece of city infrastructure to collapse into the Patapsco River.
Shortly after the incident, a rescue mission, investigation, and cleanup ensued. As for the long-term response plan, not much has been announced apart from an approved $60 million in federal aid to rebuild.
To gauge the impact on traffic patterns, our team pulled key data points from our massive driving behavior database. We looked at traffic across the greater Baltimore area, focusing on average speeds and total trips, and comparing those statistics from one week before and one week after the incident took place.
Here are four traffic takeaways from the Baltimore bridge collapse.
#1 Overall traffic in the greater Baltimore area declined by 4% in the seven days following the incident.
#2 The I-95 bridge, an alternative route, absorbed most of the Francis Scott Key Bridge’s traffic. Seven days after the incident, we saw an overall 17% increase in total trips taken on the I-95 bridge which caused a 17% decrease in average speed – from 54 MPH to 44 MPH.
#3 However, the evening commute on the I-95 bridge was disproportionately impacted with a 21% increase in total trips and a 34% decrease in average speed – from 52 MPH to 34 MPH.
#4 Two other alternative routes, the Fort McHenry and Harbor Tunnels, were minimally impacted.
While the Francis Scott Key Bridge collapse clearly made an impact on Baltimore’s transportation ecosystem, there are other impacts (big and small) that require cities to act quickly if they want to avoid a major disruption.
Near real-time traffic insights help cities quickly identify delays, as well as understand the personal and commercial economic impacts that rerouting creates.
With more than 40 million connections to U.S. drivers, Arity Real Time Traffic feeds have the granular minute-by-minute speed and density insights needed to detect delays. We provide representation across all regions and road types, with more than 65% of our data from arterial roads which fleet data often misses.
Backed by the largest driving behavior database informed by decades of understanding insurance risk, our public sector solutions provide a unique view into traffic patterns and driving behavior.
In addition to Real Time Traffic, Arity Aggregated Traffic accurately shows the historical traffic trends that impact infrastructure planning. And our driving events insights – including distracted driving, speeding, and more – work with Michelin Mobility Intelligence to benchmark road segments and inform “Safer Roads” plans.
Ready to take action? Arity is heading to ITS America (ITSA) 2024 in Phoenix, AZ to help accelerate a smarter, safer, and more data-driven transportation ecosystem. Let’s connect!