Mobility data reveals consumer demand shifts when a new grocery store comes to town Read article


It seems like there are so many changes happening right now that it’s hard to keep up. As we try to balance a return to “normal” alongside the continued risks posed by COVID-19, America is entering a new phase of its response to the COVID-19 pandemic.
Some cities have reopened restaurants and parks and other businesses, while others are still enforcing broad social distancing policies. On top of the response to the pandemic, people are coming together to demand solutions for the racial and economic inequality that Black Americans face. These historic events interact with each other in complex ways.
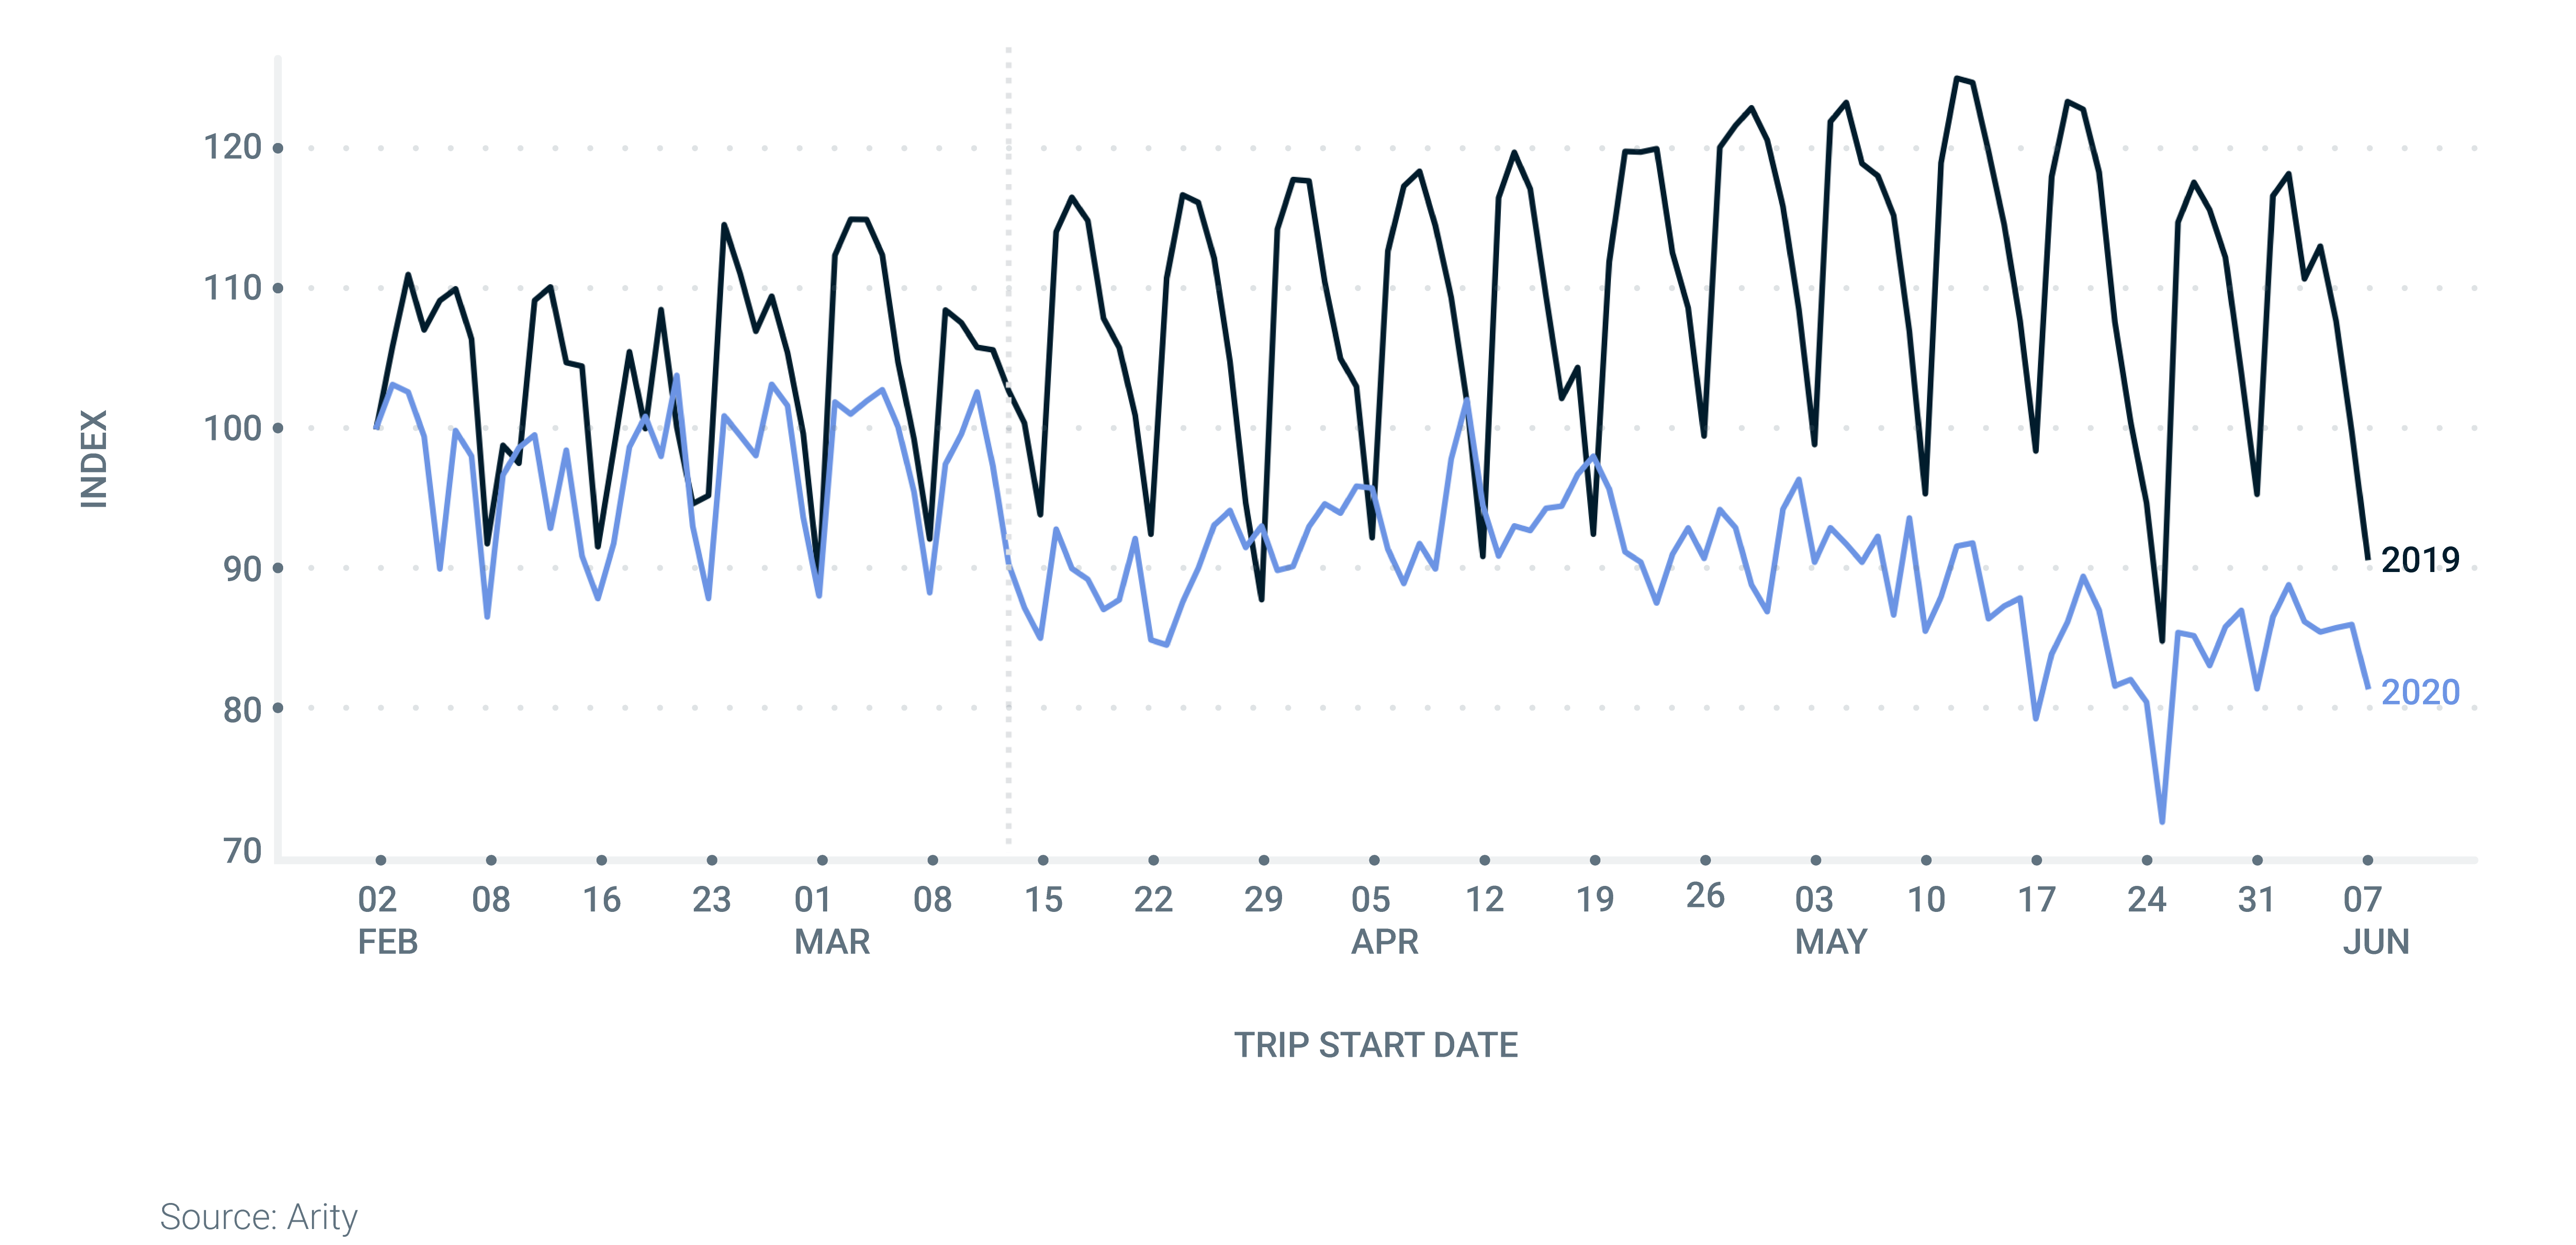
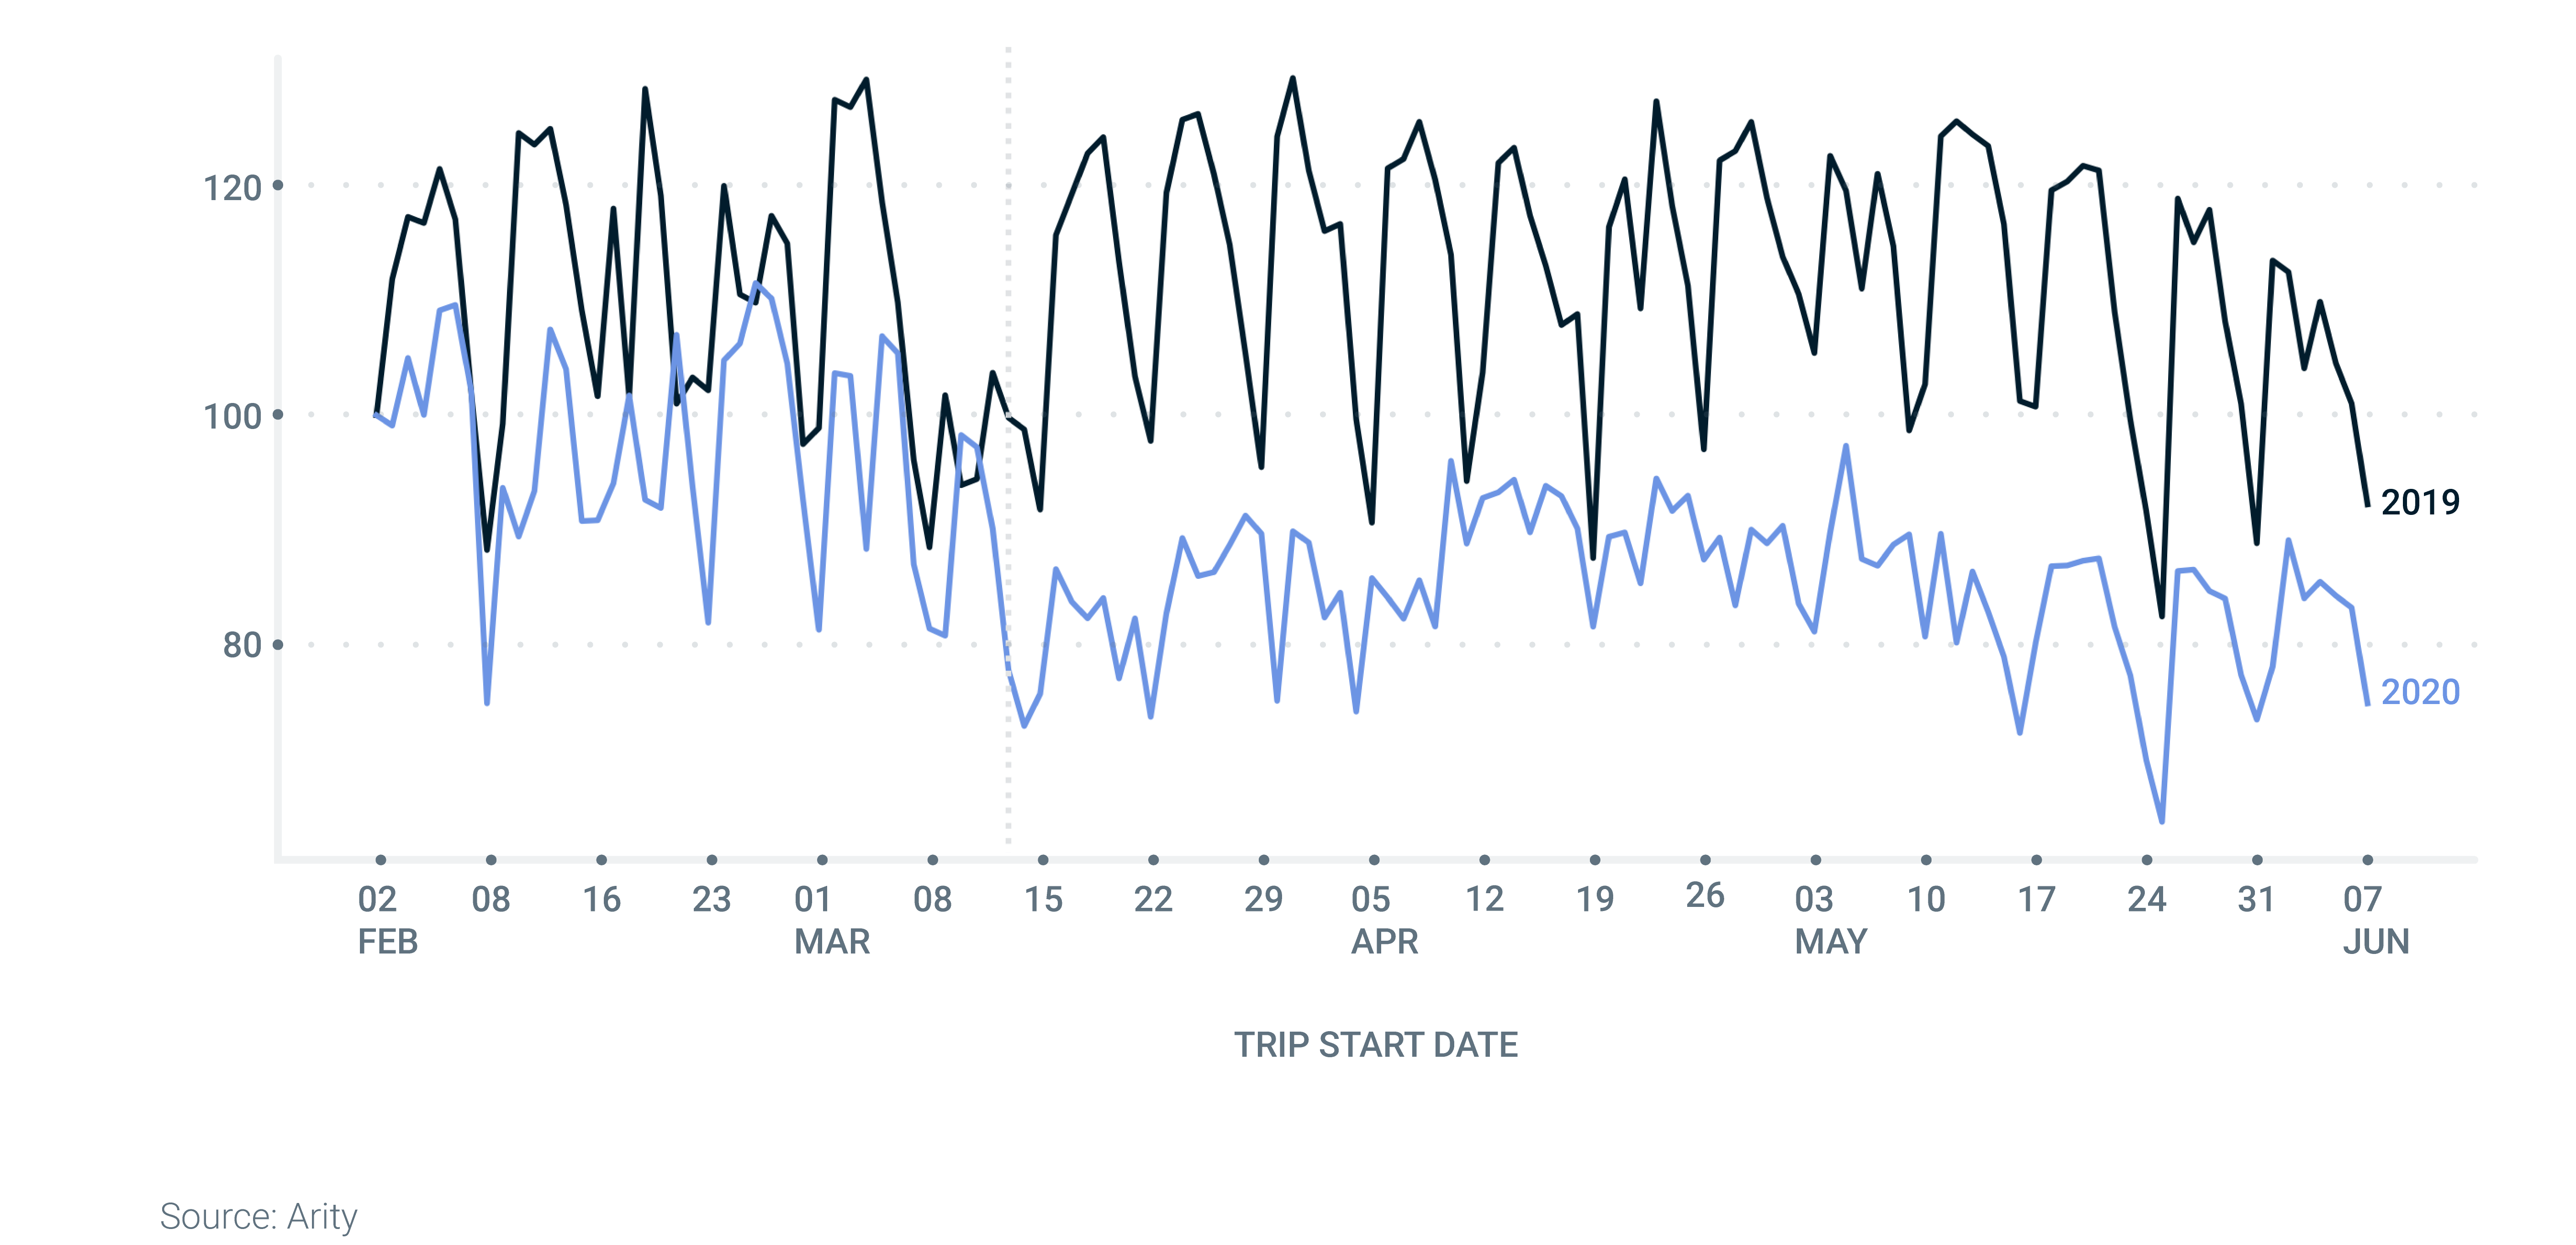
In prior posts, we discussed the drop we saw in core driving metrics, such as miles driven, and how driving changes at the local level are important to watch. Since then, we have seen driver behavior change again, with an upward trend in miles driven and many areas are now returning to pre-COVID-19 levels of driving. In fact, in states like Wyoming, we are actually seeing more traffic than we’d expect due to increased tourism as national parks reopen.

We know that driving risk is measured not only by how long people are on the road but also by the choices people make during trips. Driving safely includes limiting your speed, predictable and smooth acceleration, and deceleration, avoiding high-risk hours, and, of course, setting down the phone.
At Arity, we are passionate about using data from phone and vehicle sensors to understand driving and accurately identify risky behaviors. Our driver data helps make roads safer and insurance pricing more transparent and accurate. In the charts below, our data shows driver behavior change during the pandemic. Here are some highlights:
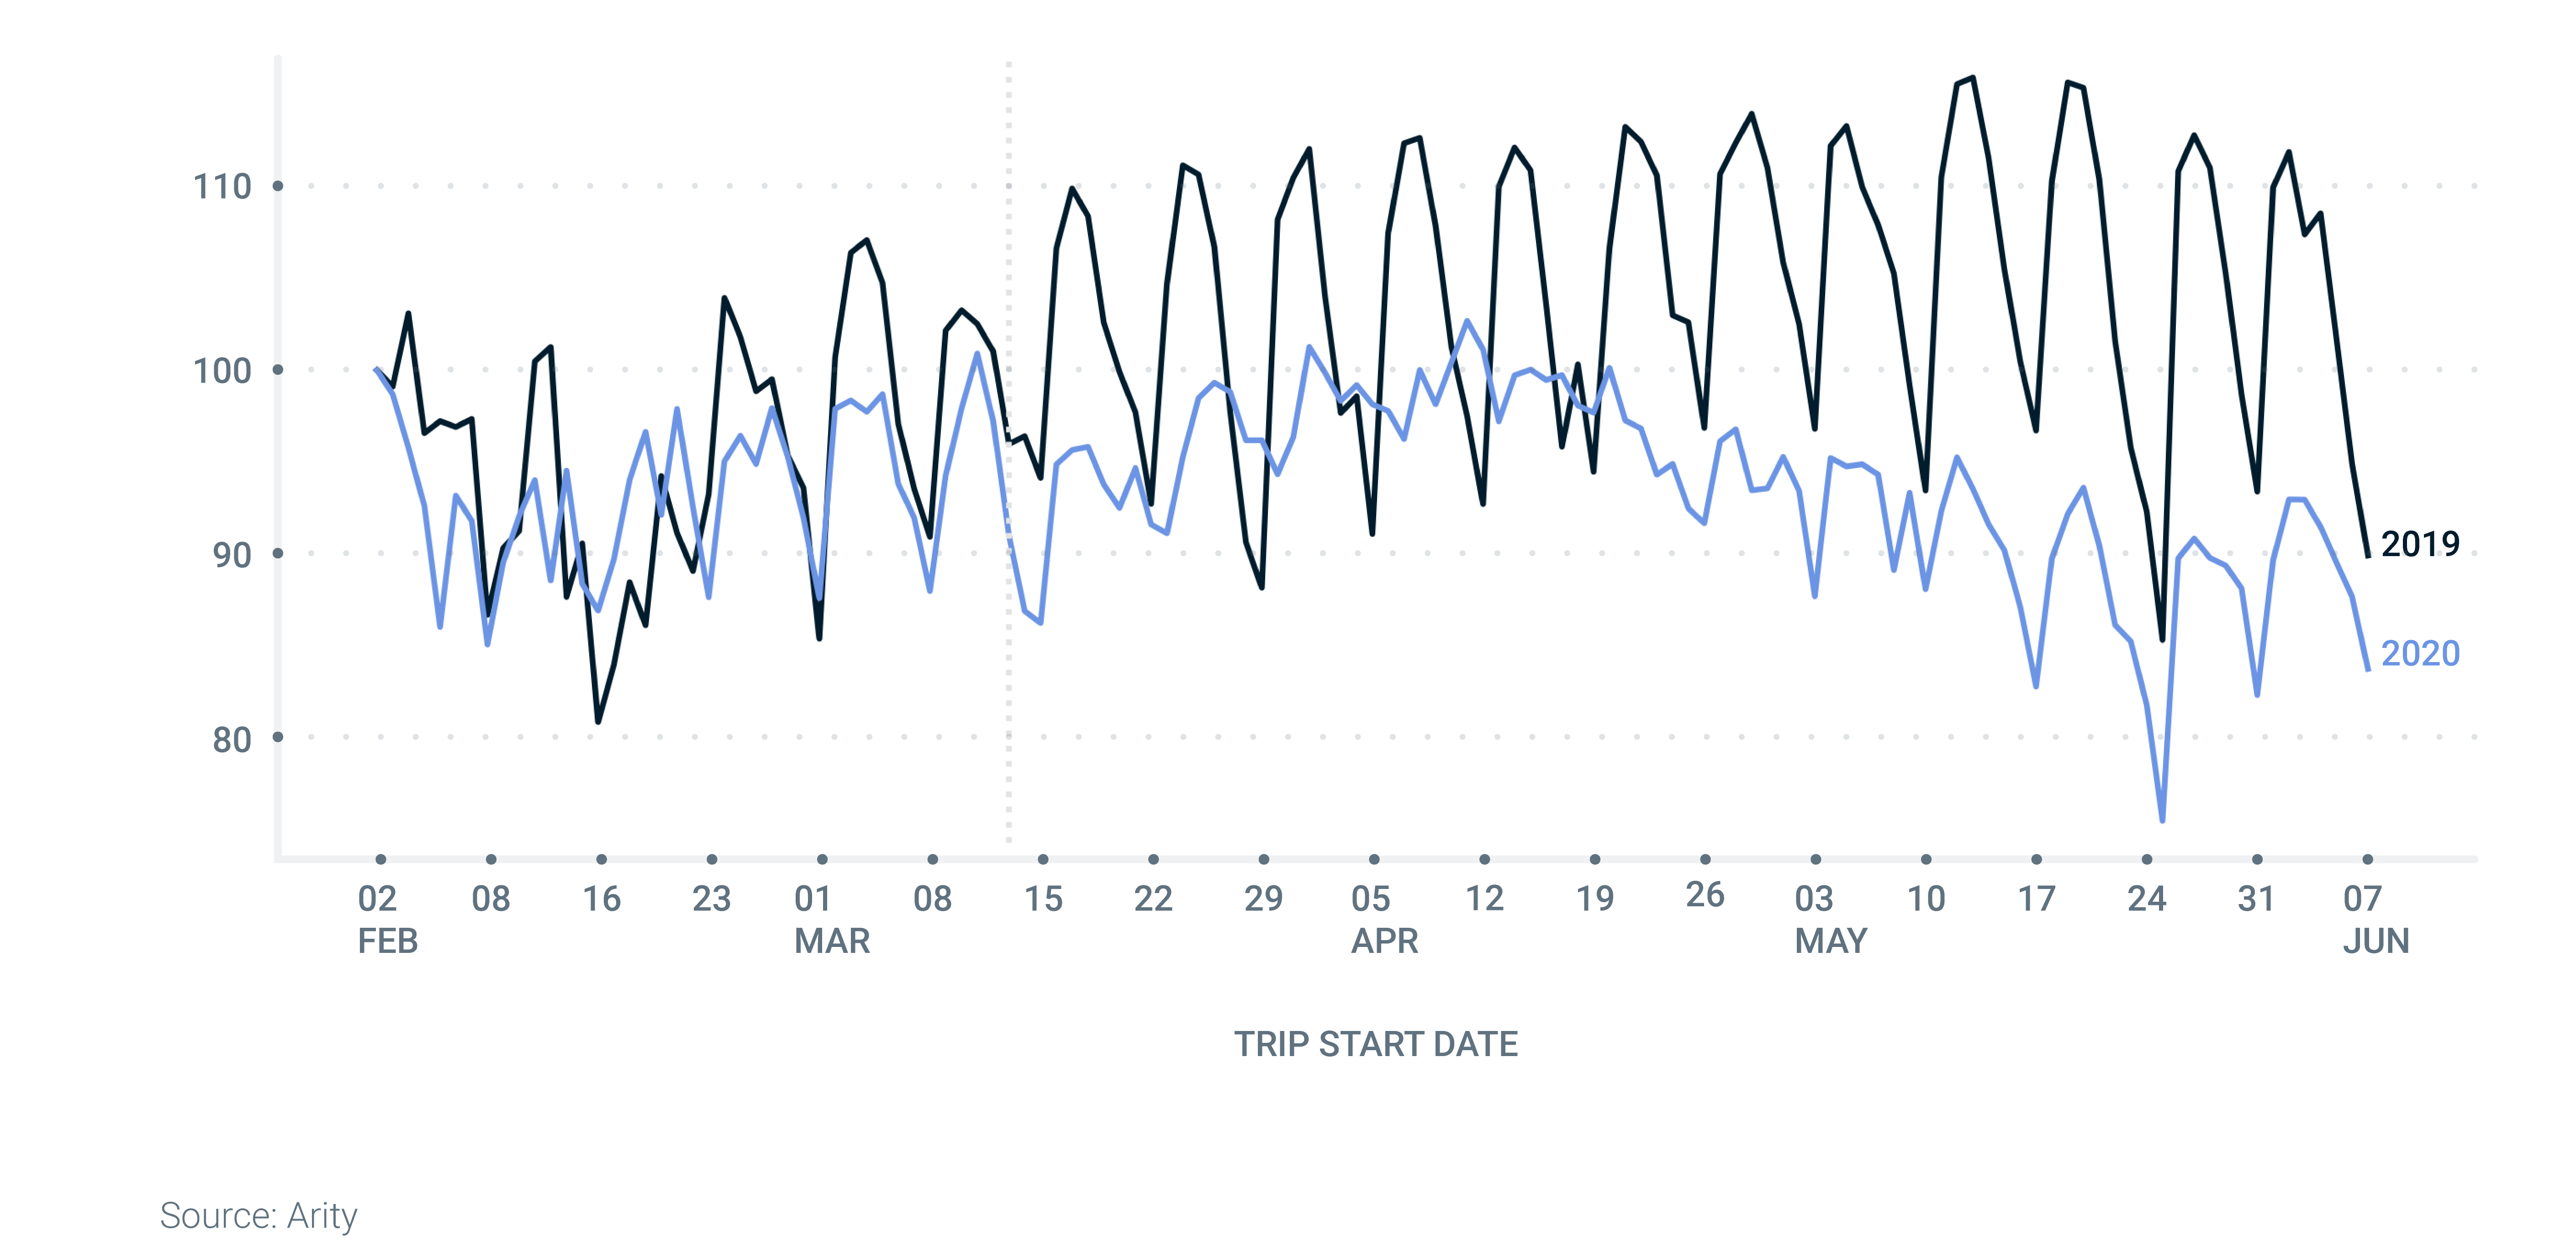
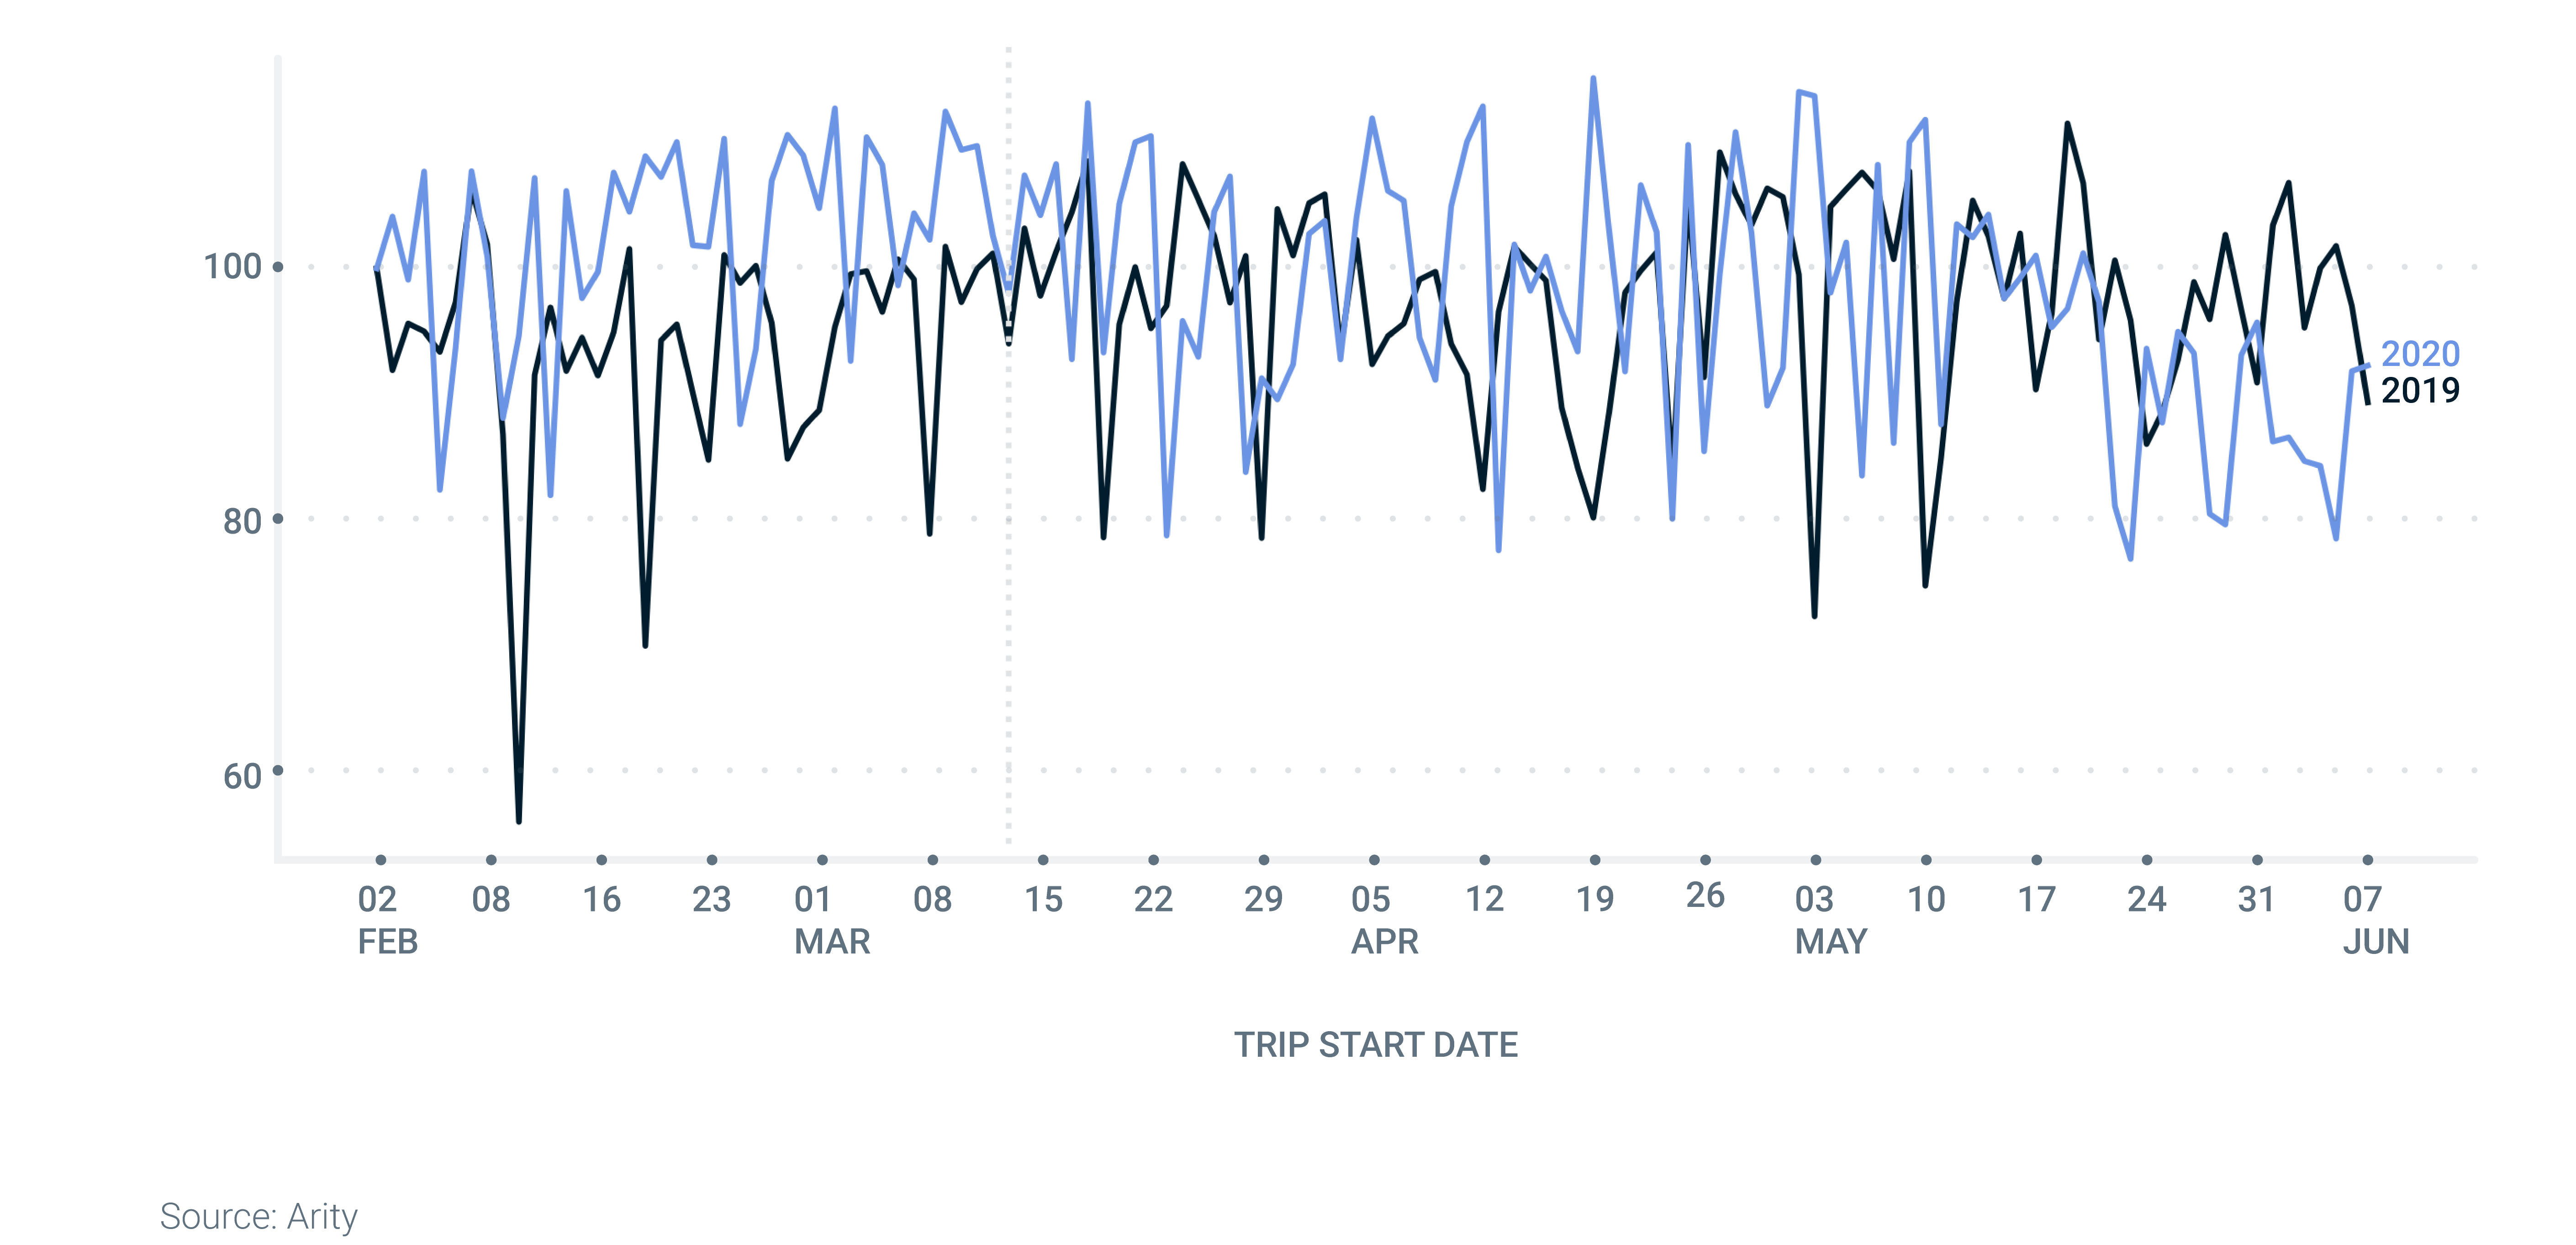
As with mileage, we see a variance in behaviors between states. For example, in Texas and New Jersey, we see different responses to the pandemic likely due to different road conditions and driving cultures.
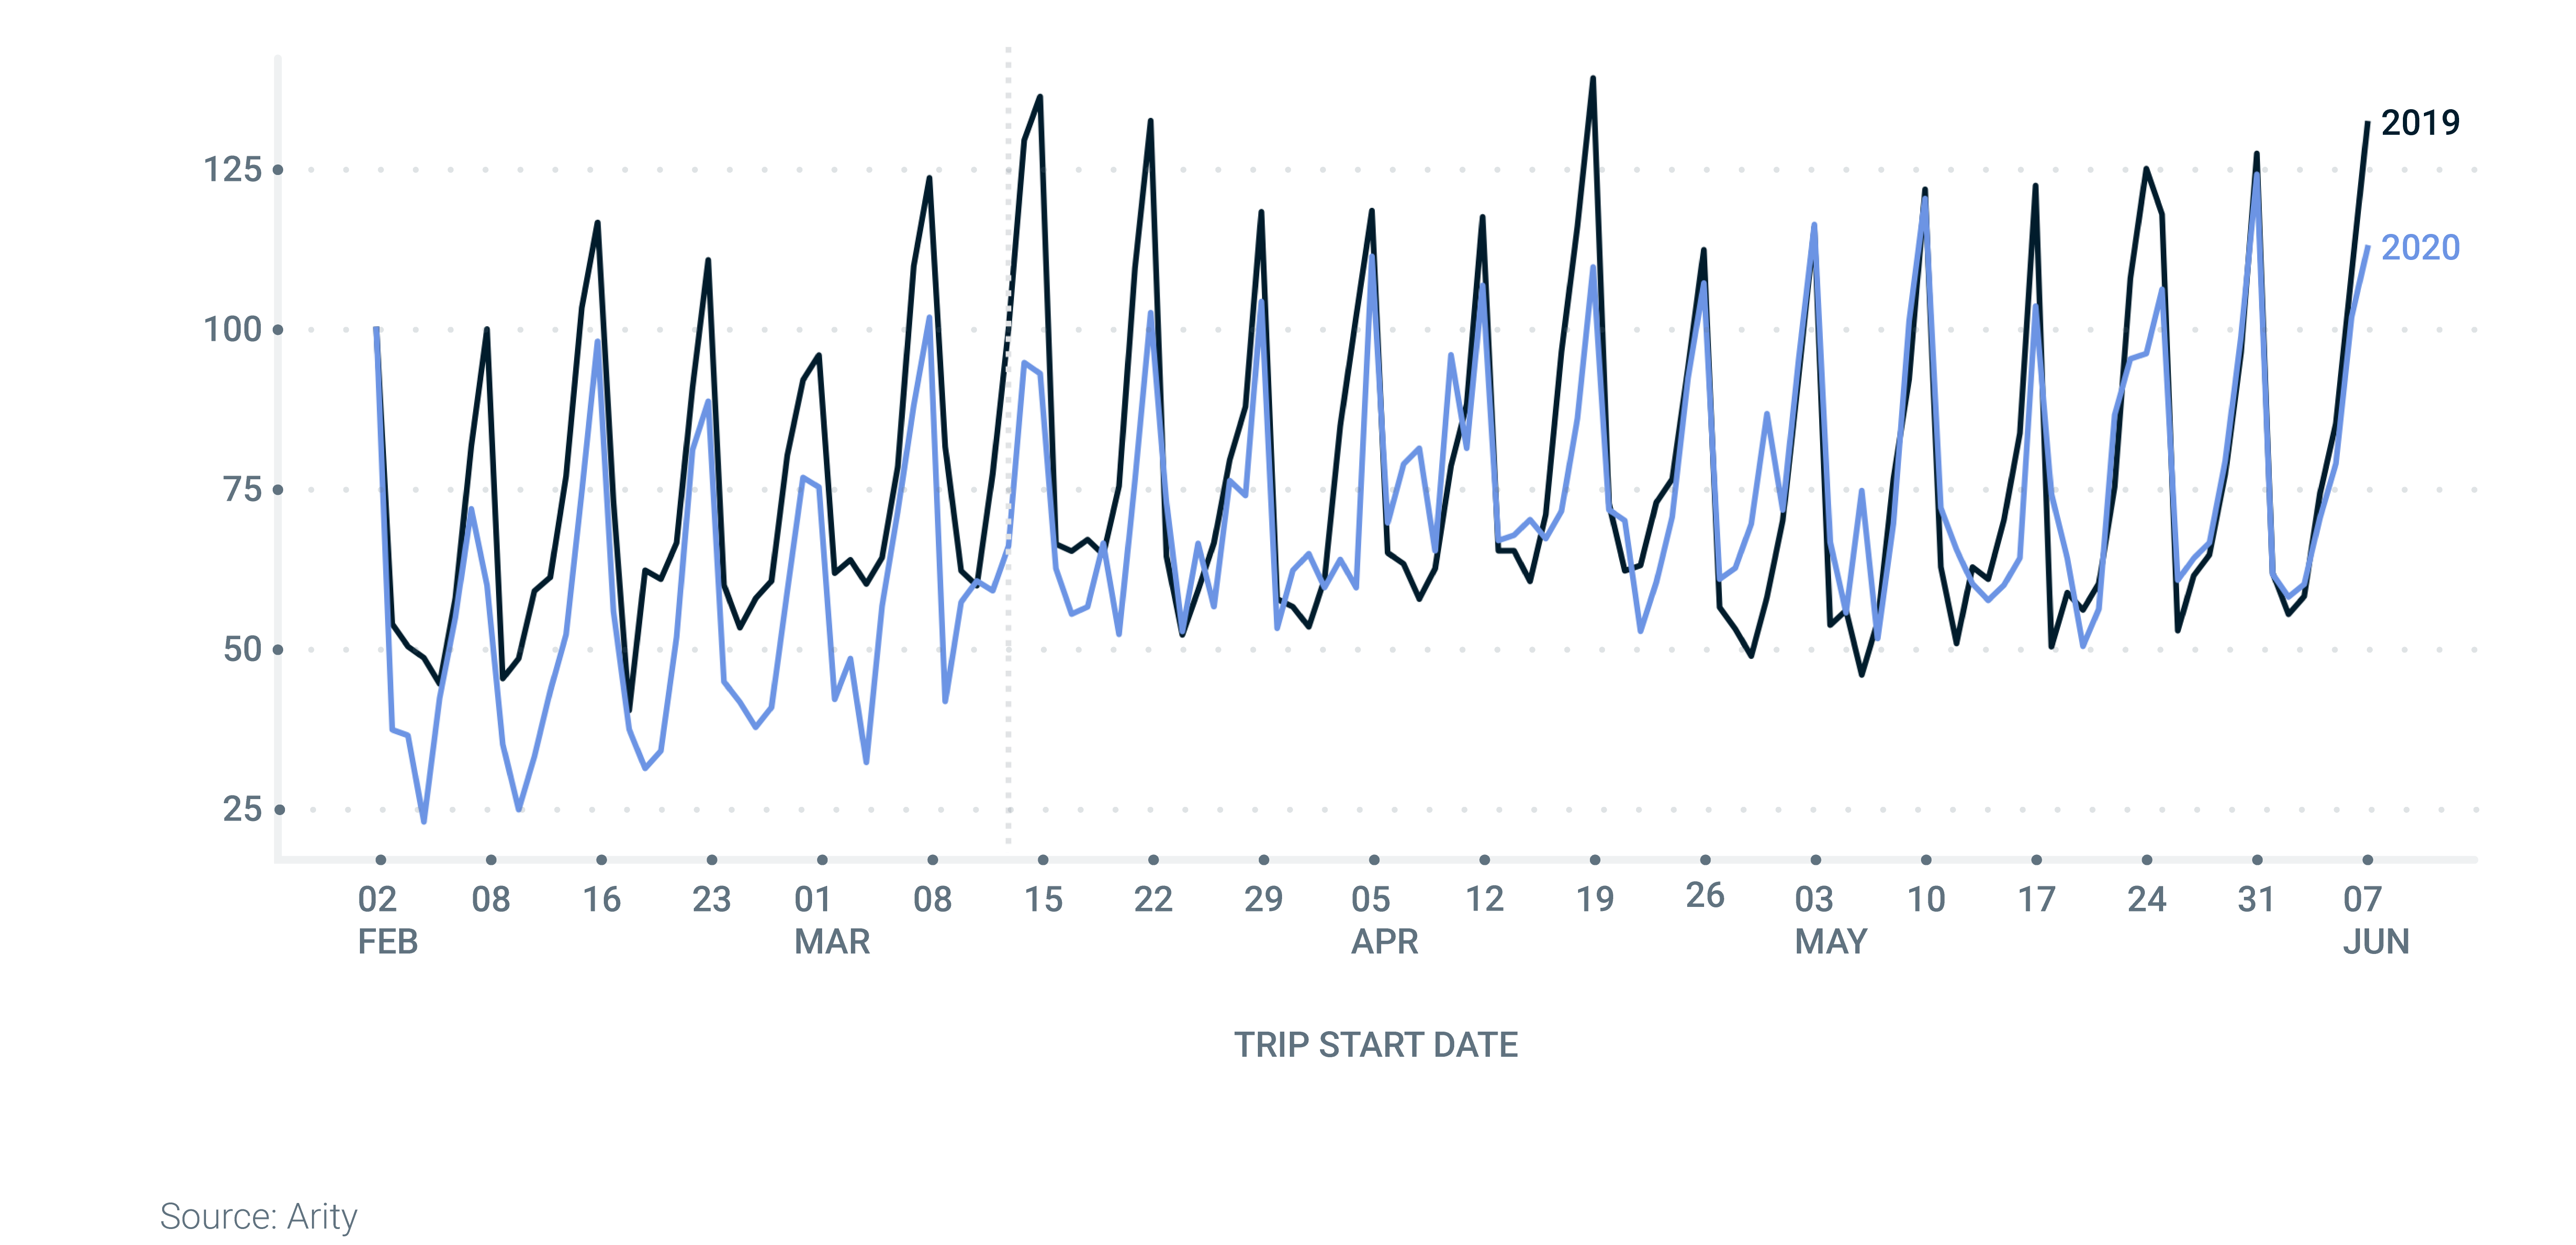
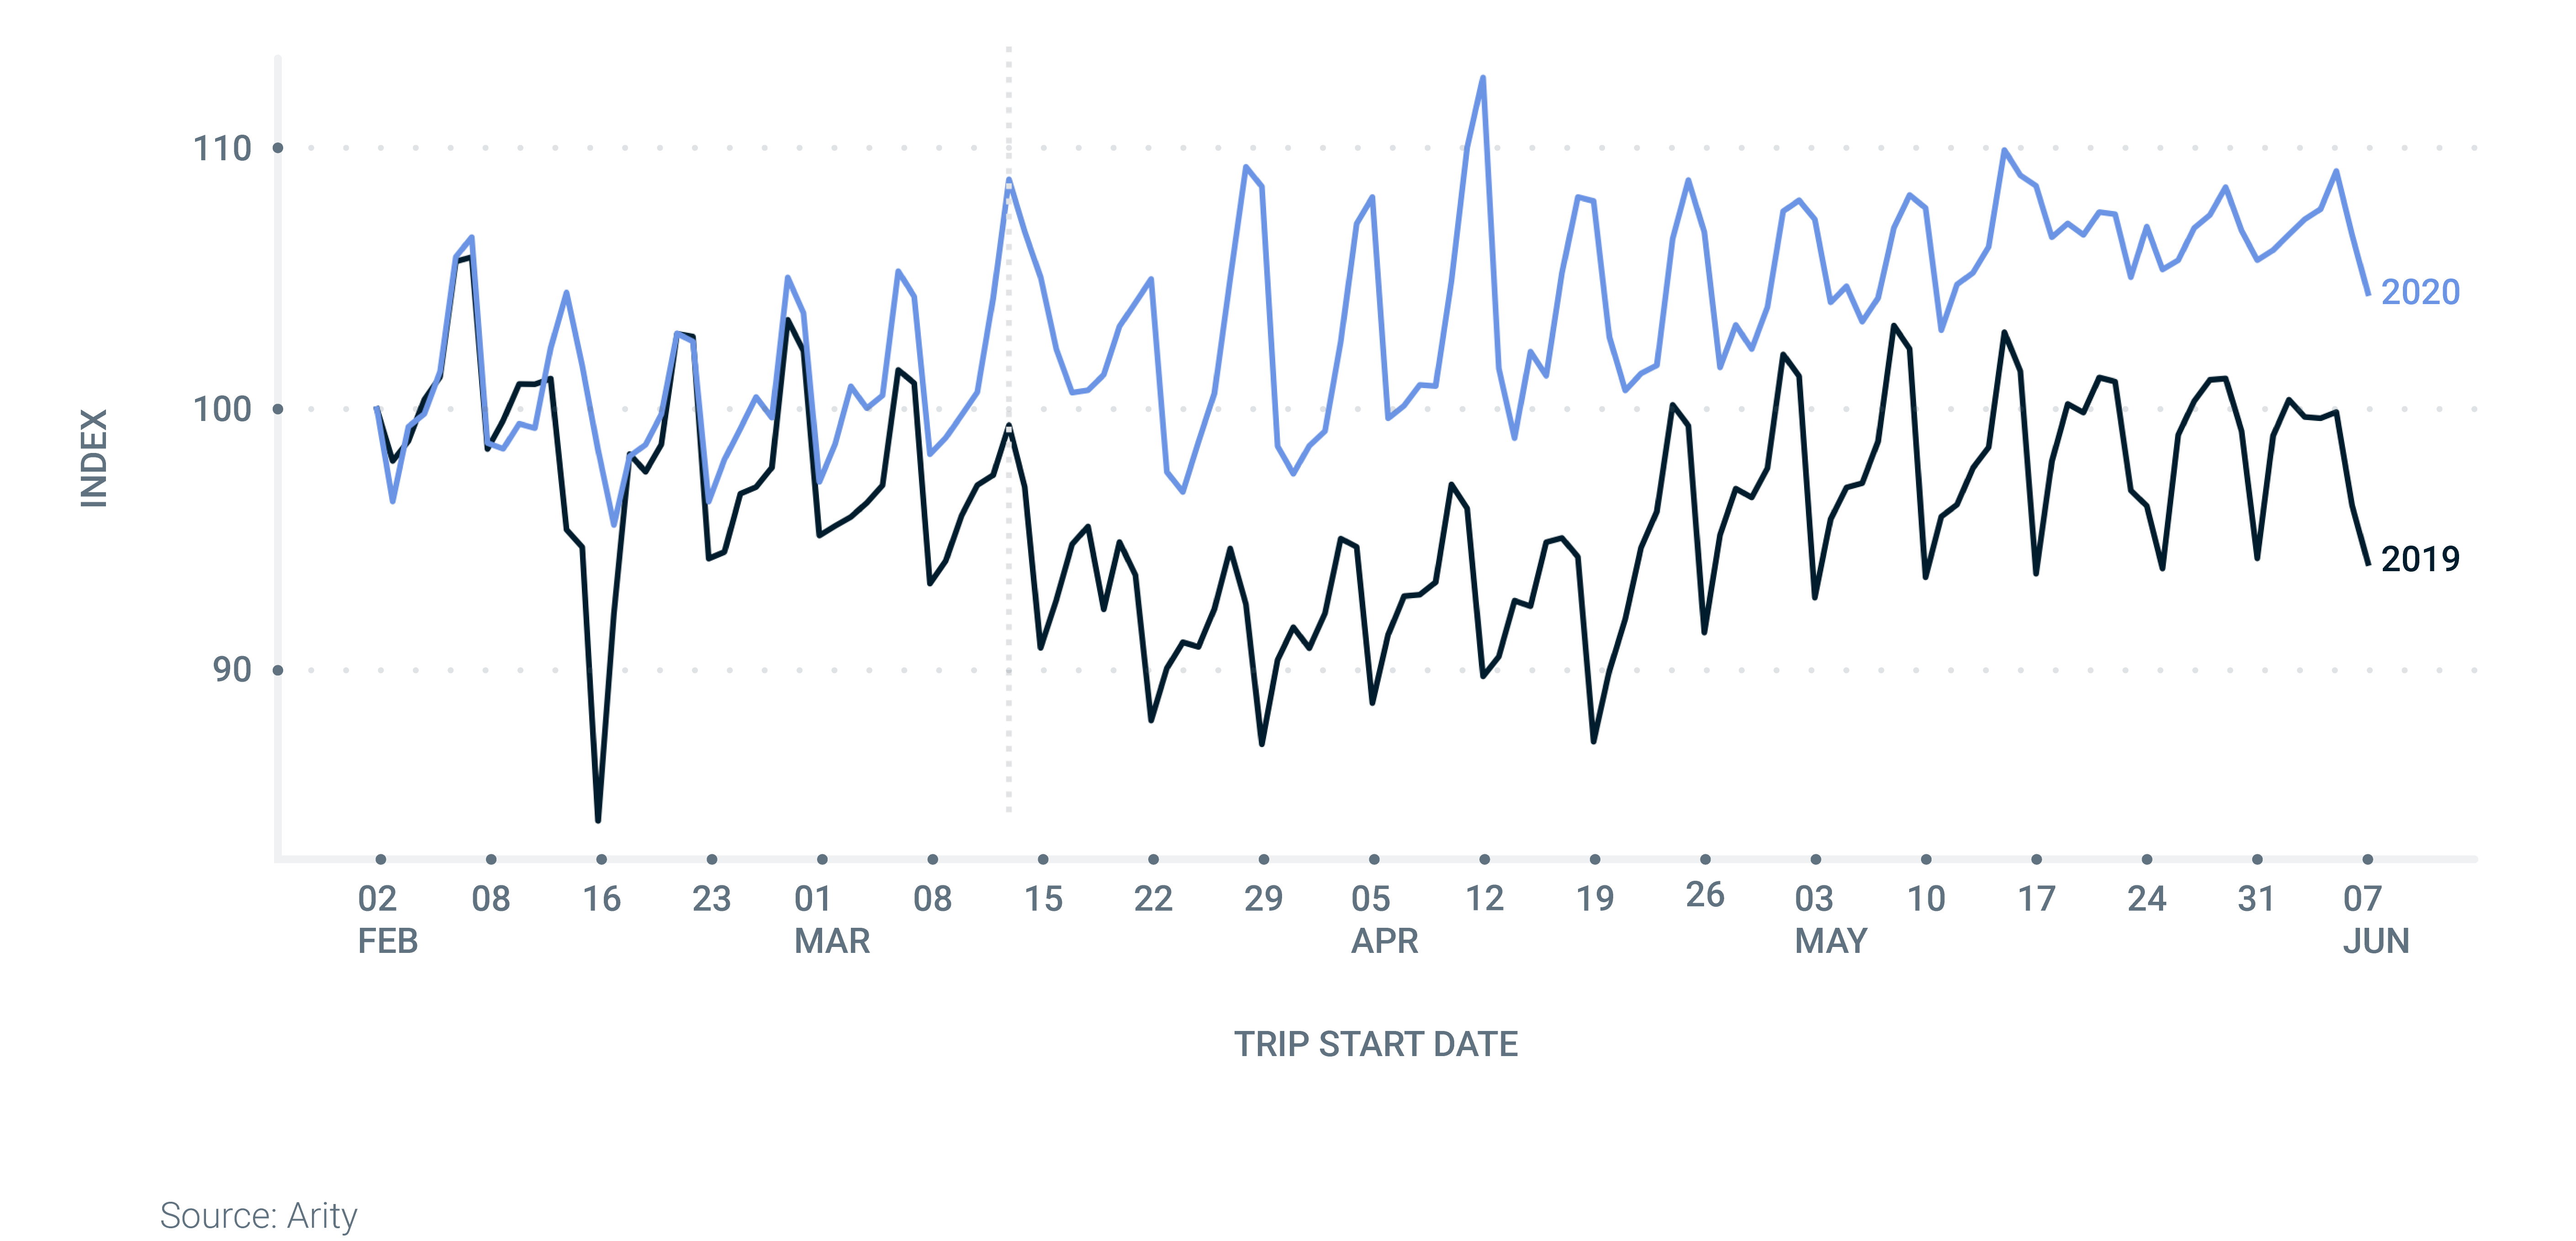
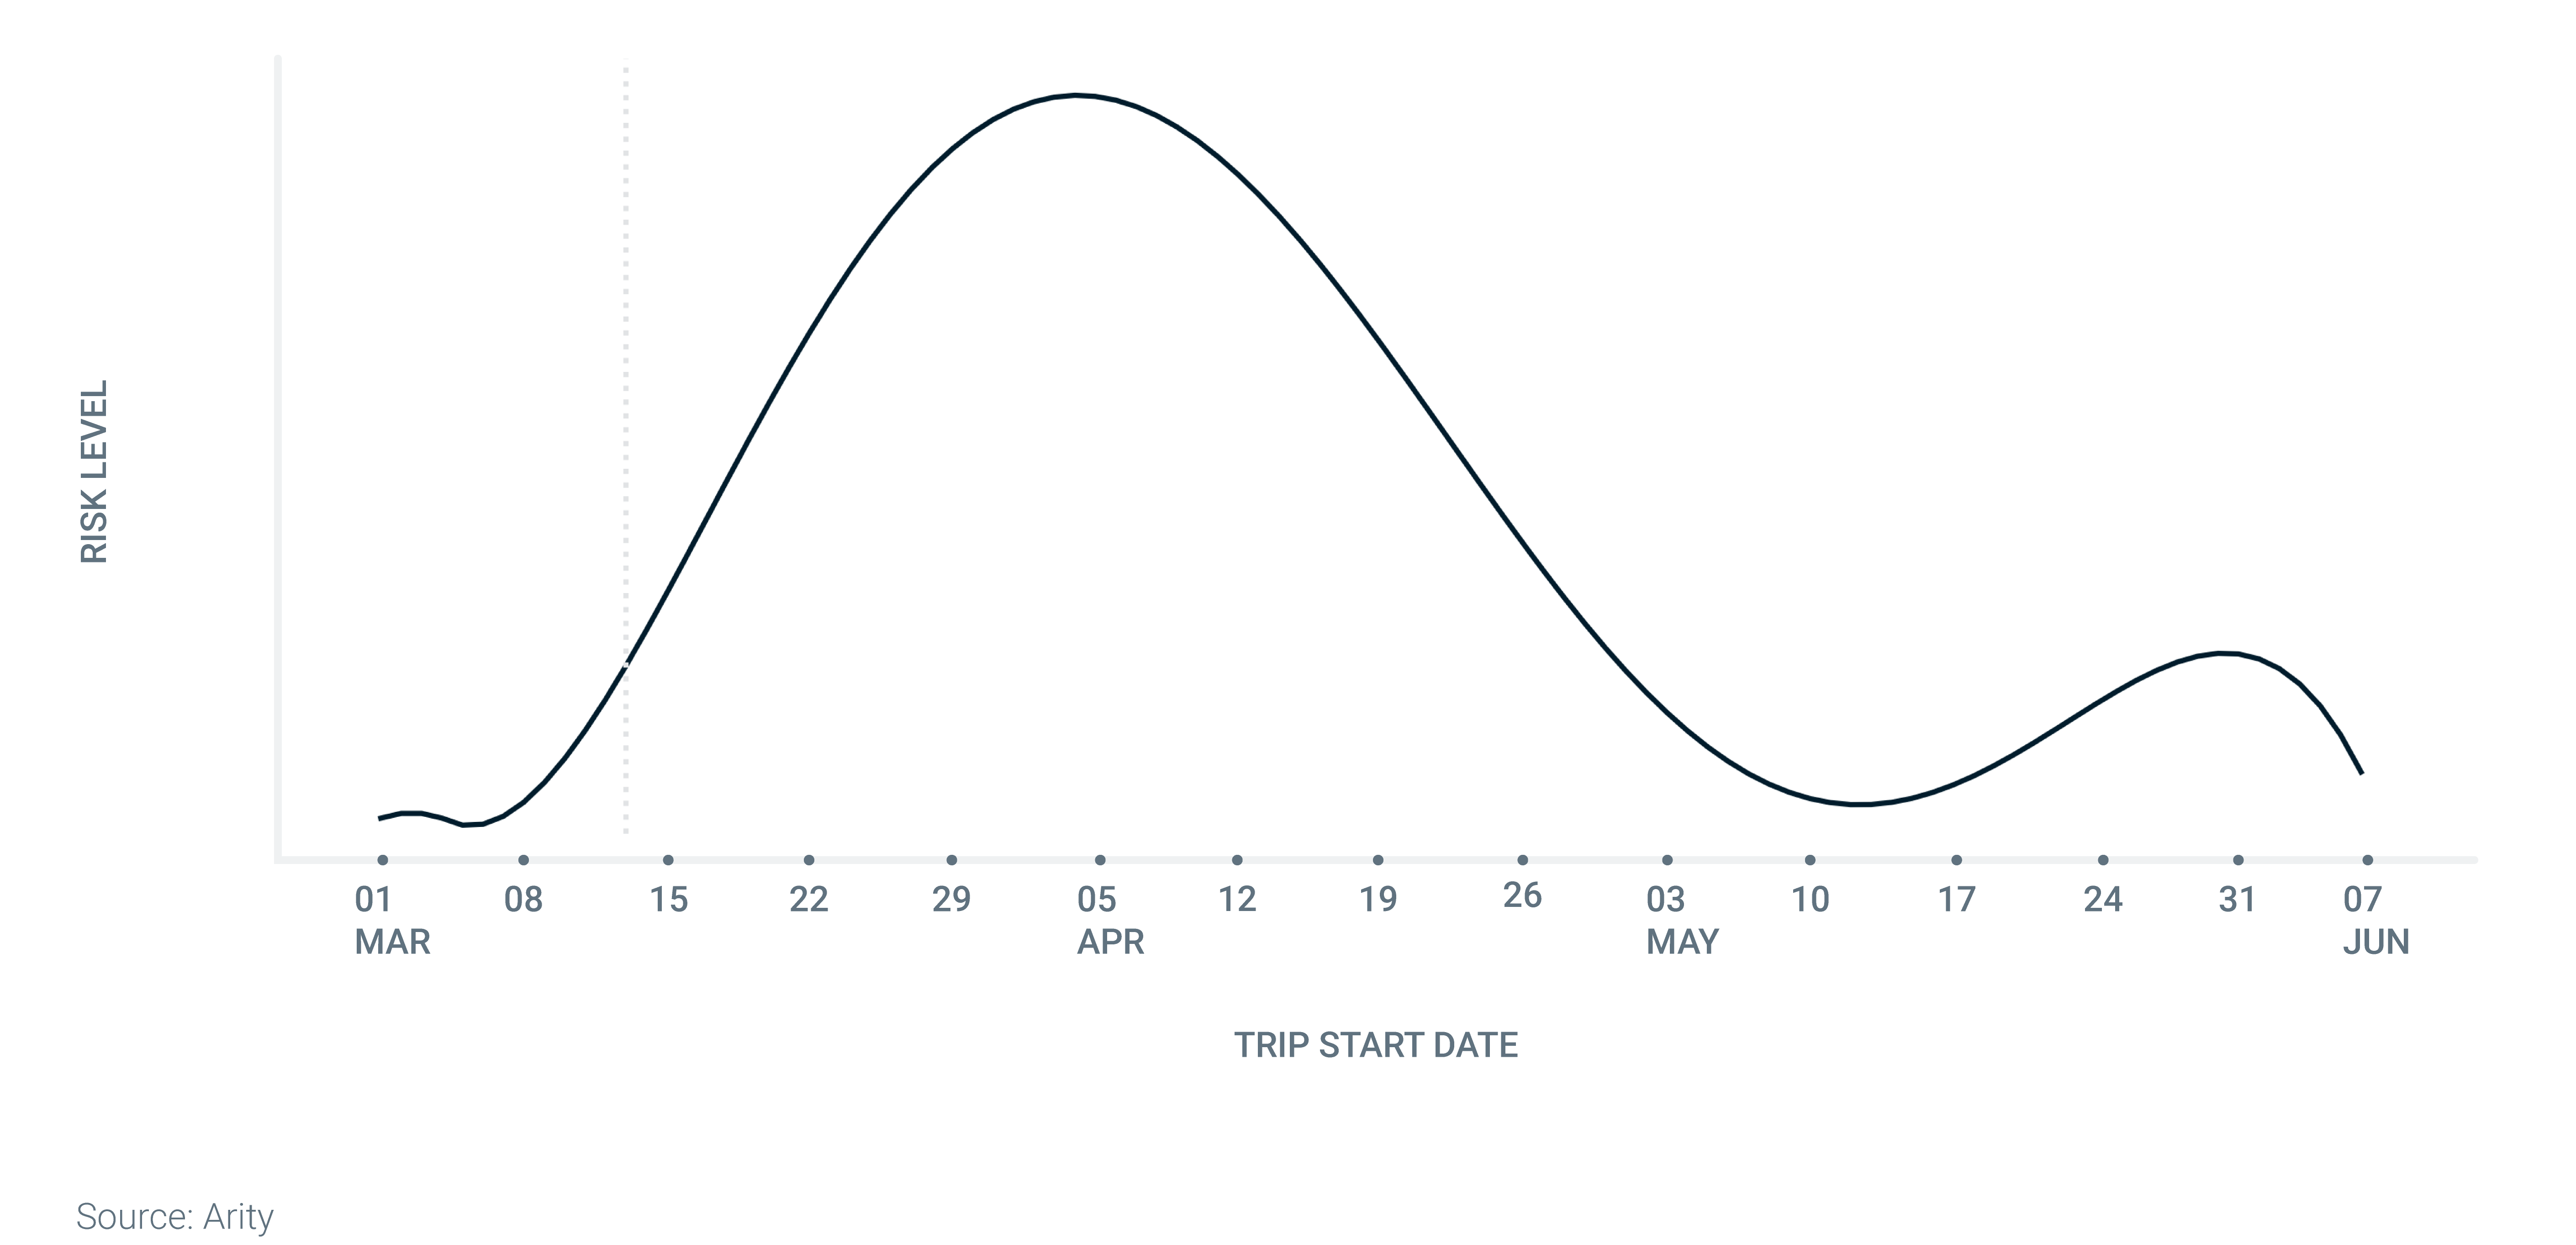
The Arity Drivesight score combines these different driving behaviors into a single measure of driving risk that is highly predictive of insurance losses. We score driving trips each day to view driving risk and driver behavior change. From our driving scoring during the height of the pandemic response, we found that driving risk per mile driven increased a small, but noticeable, amount.
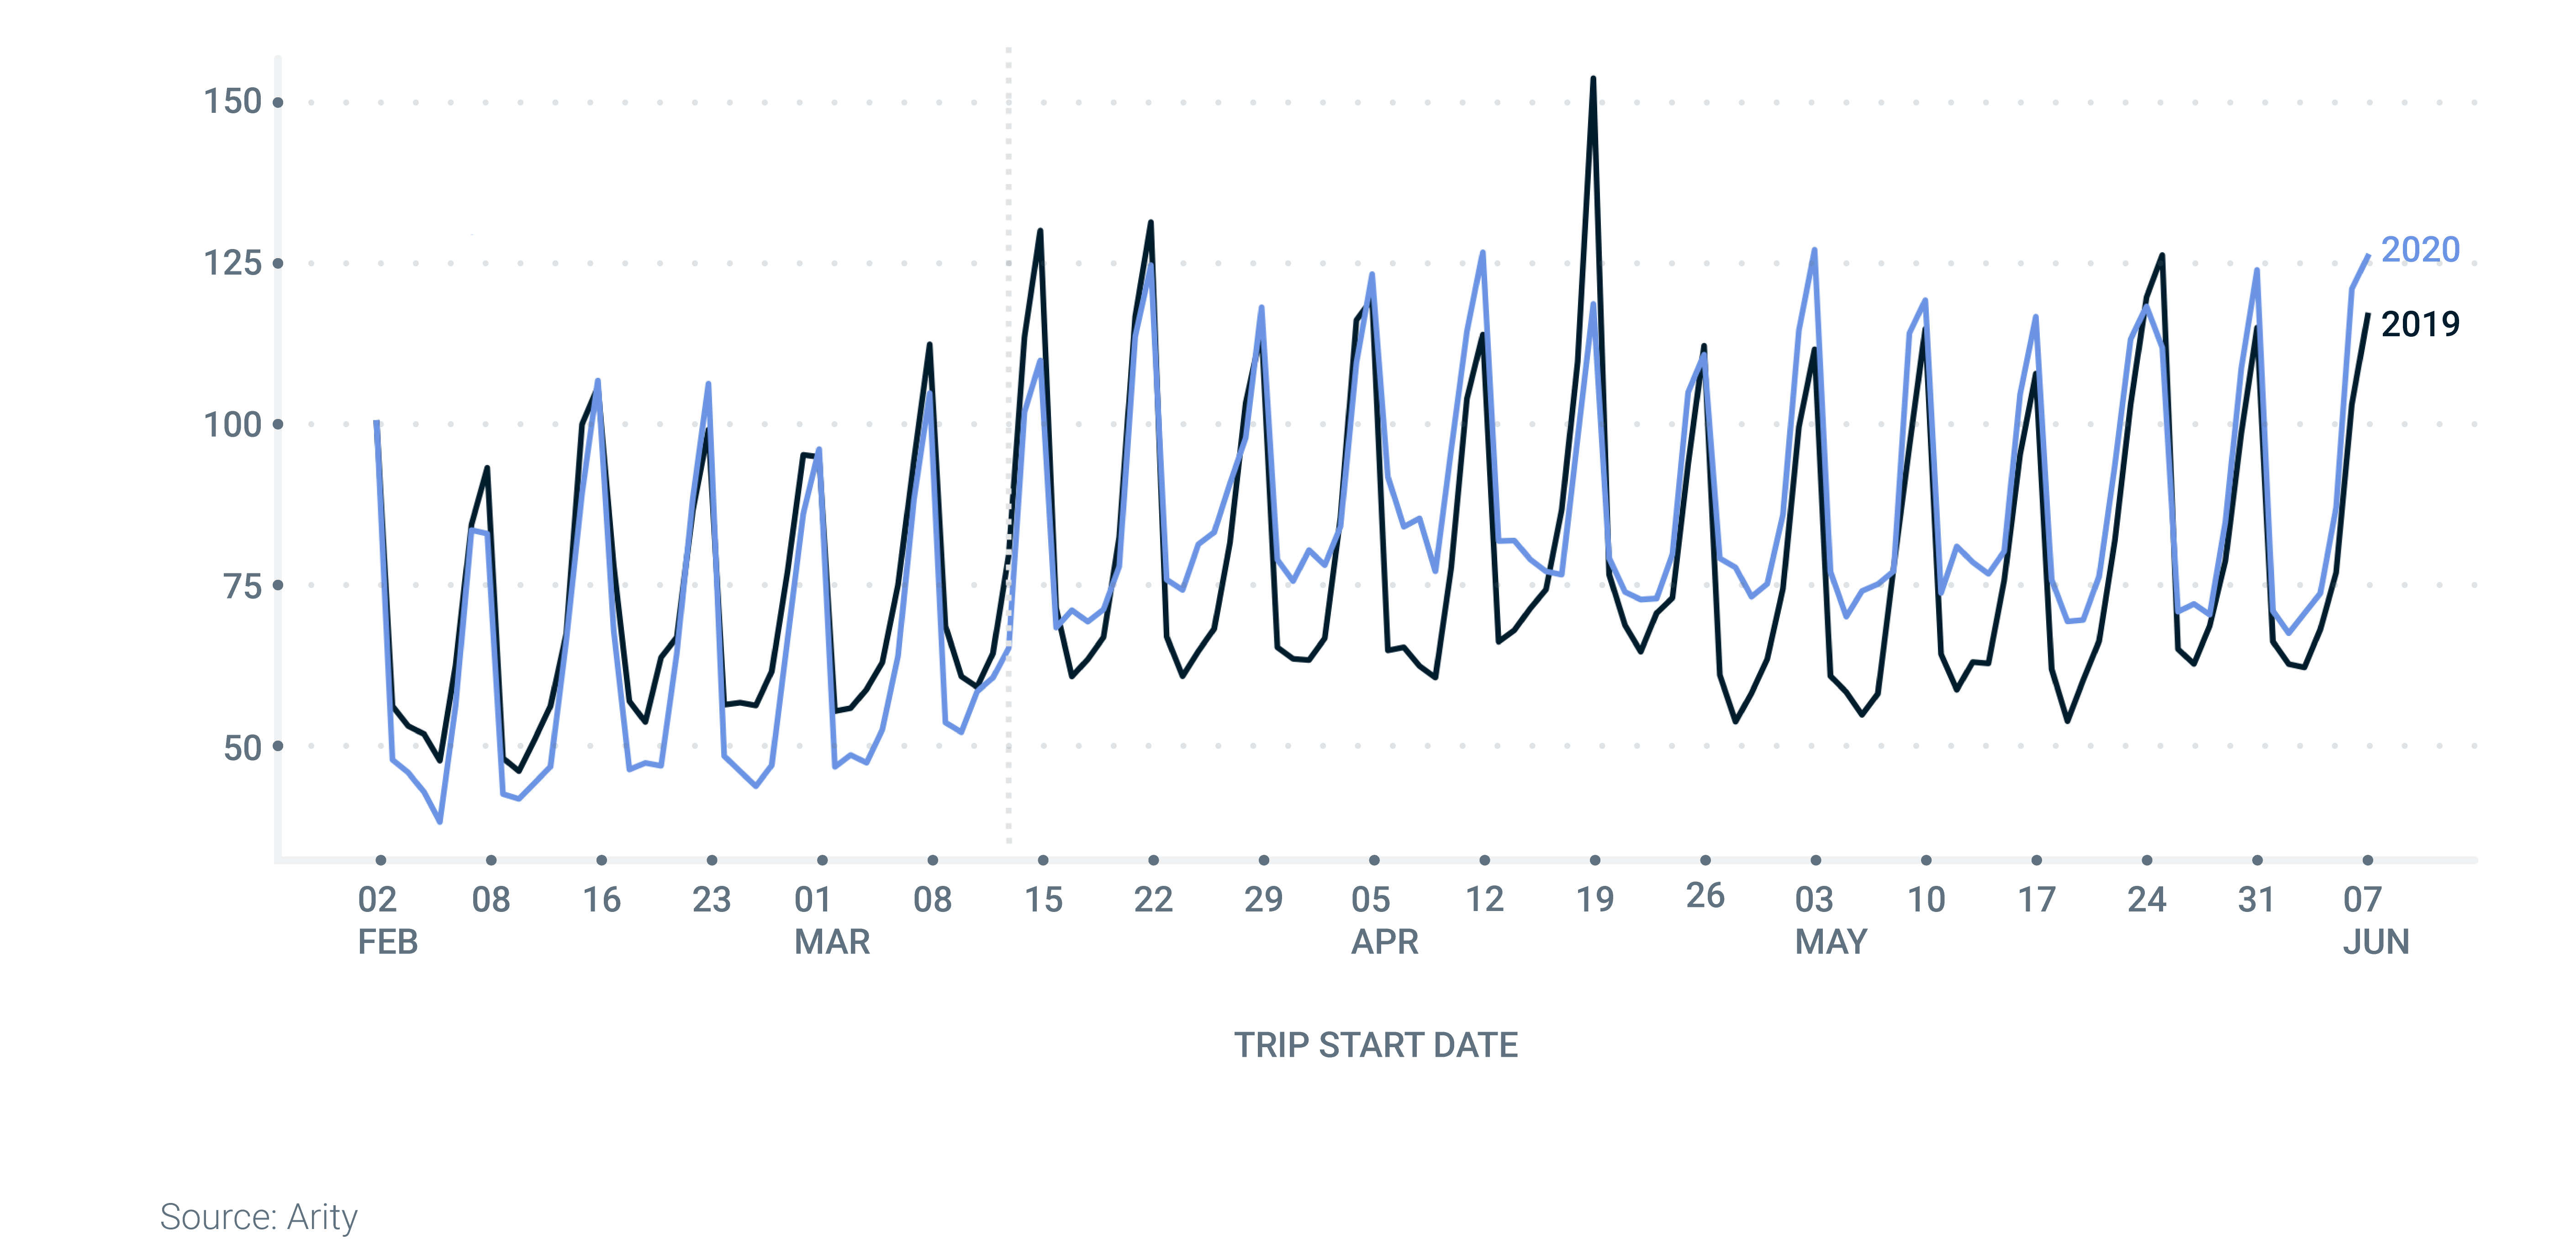
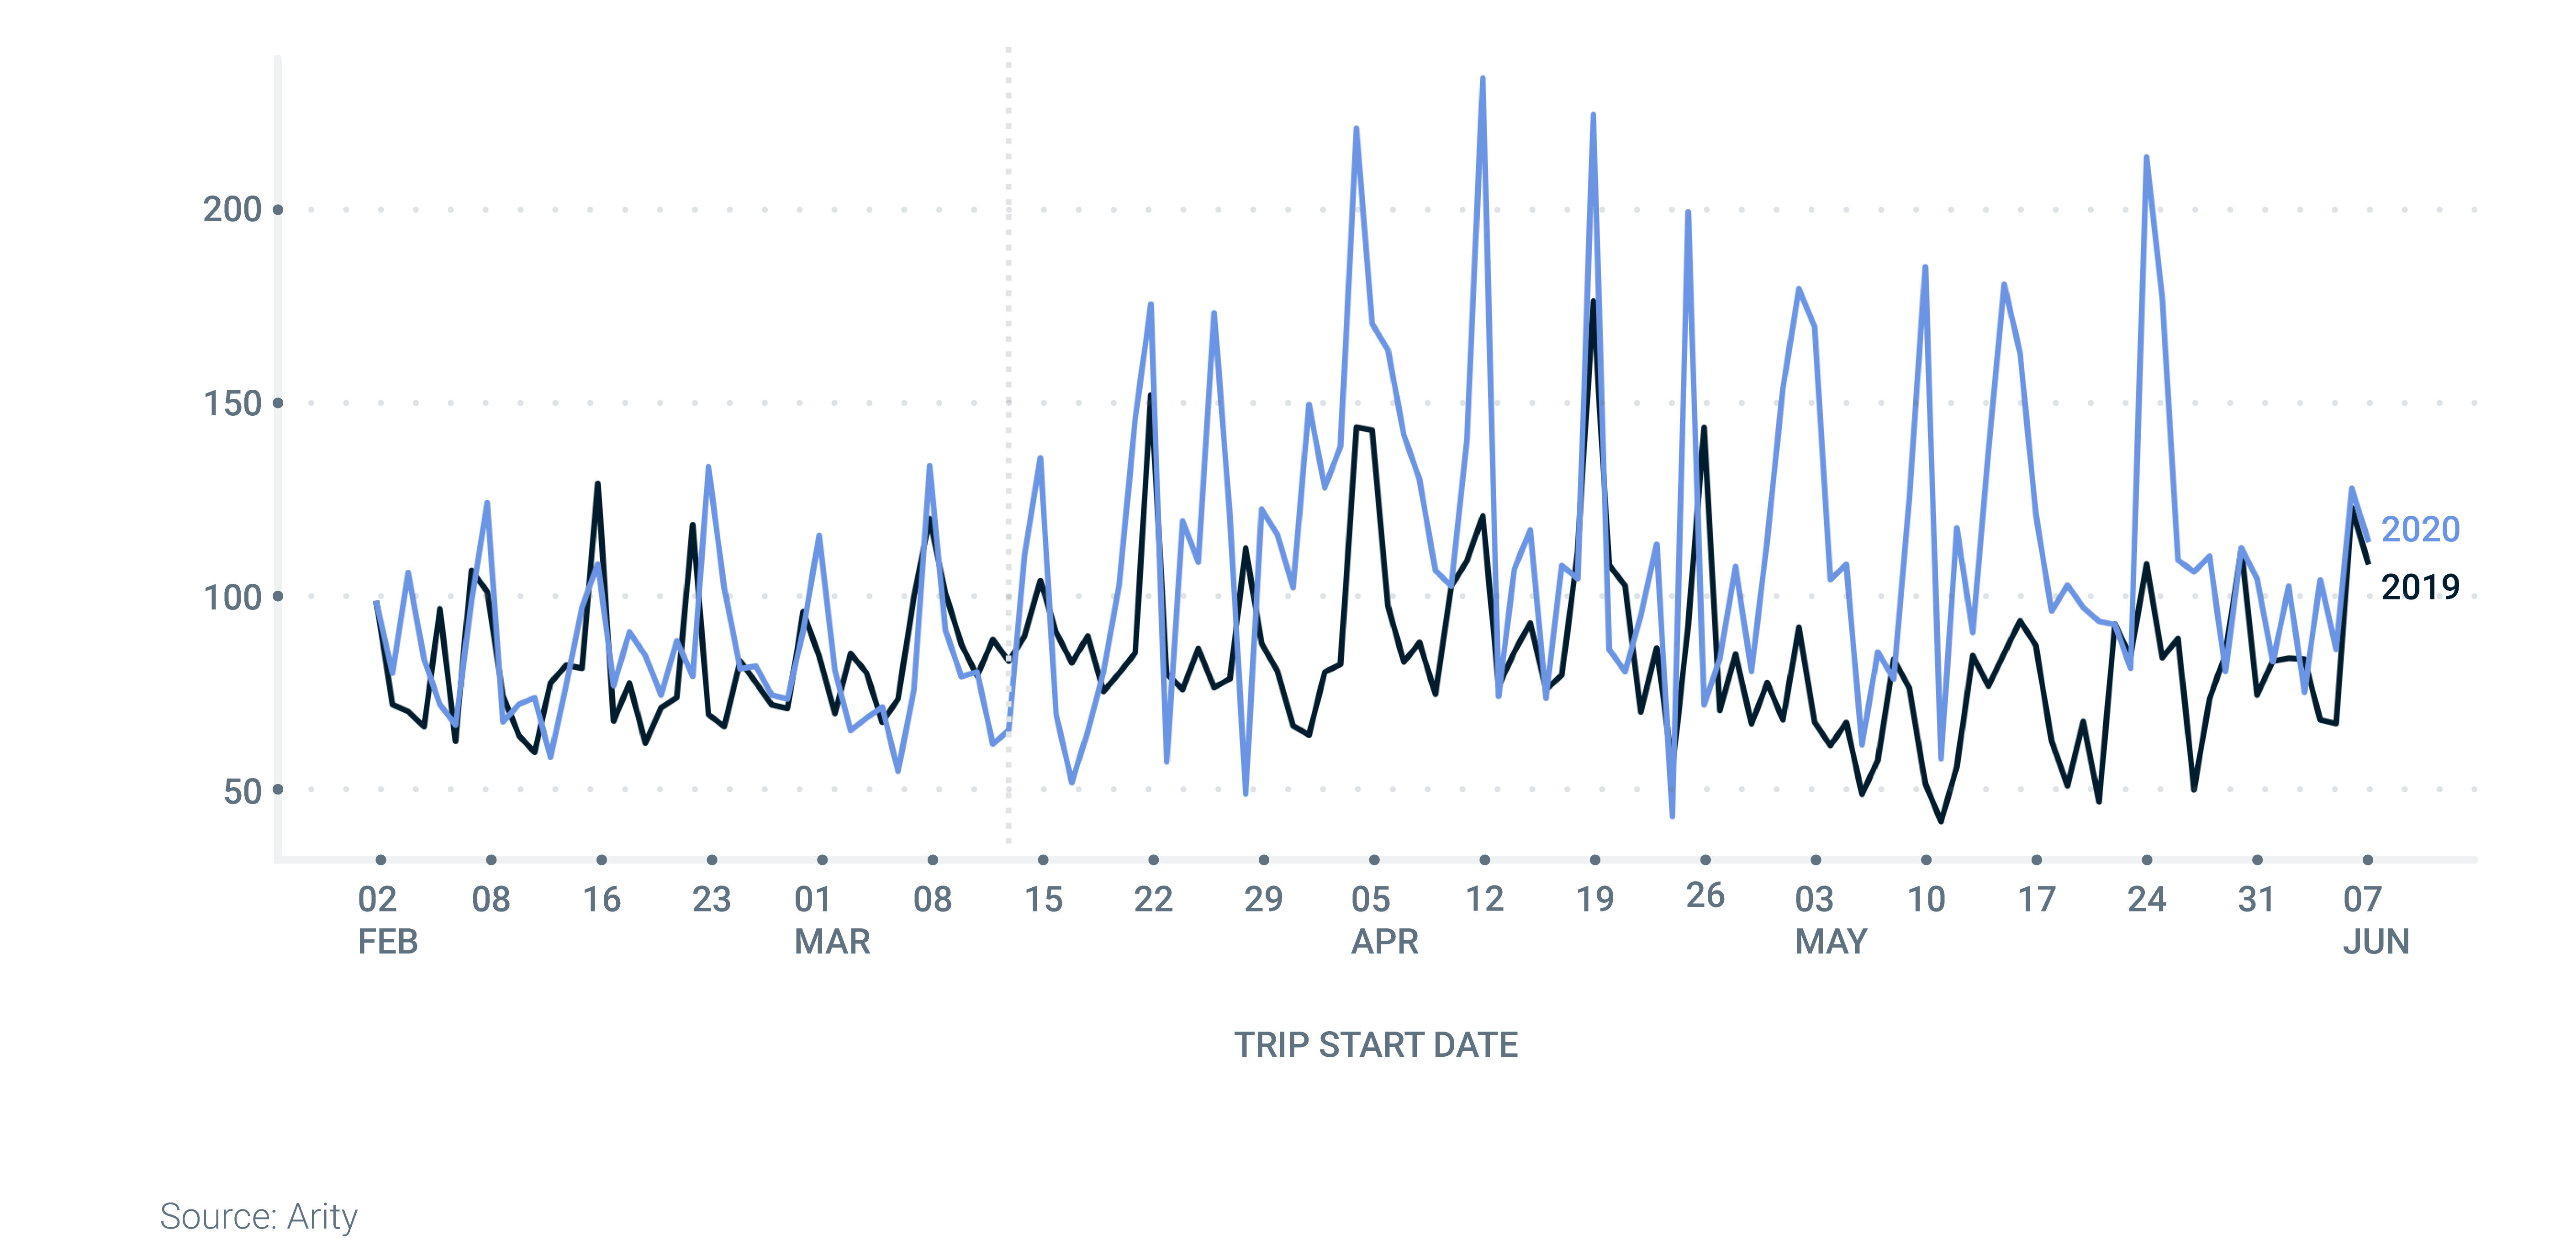
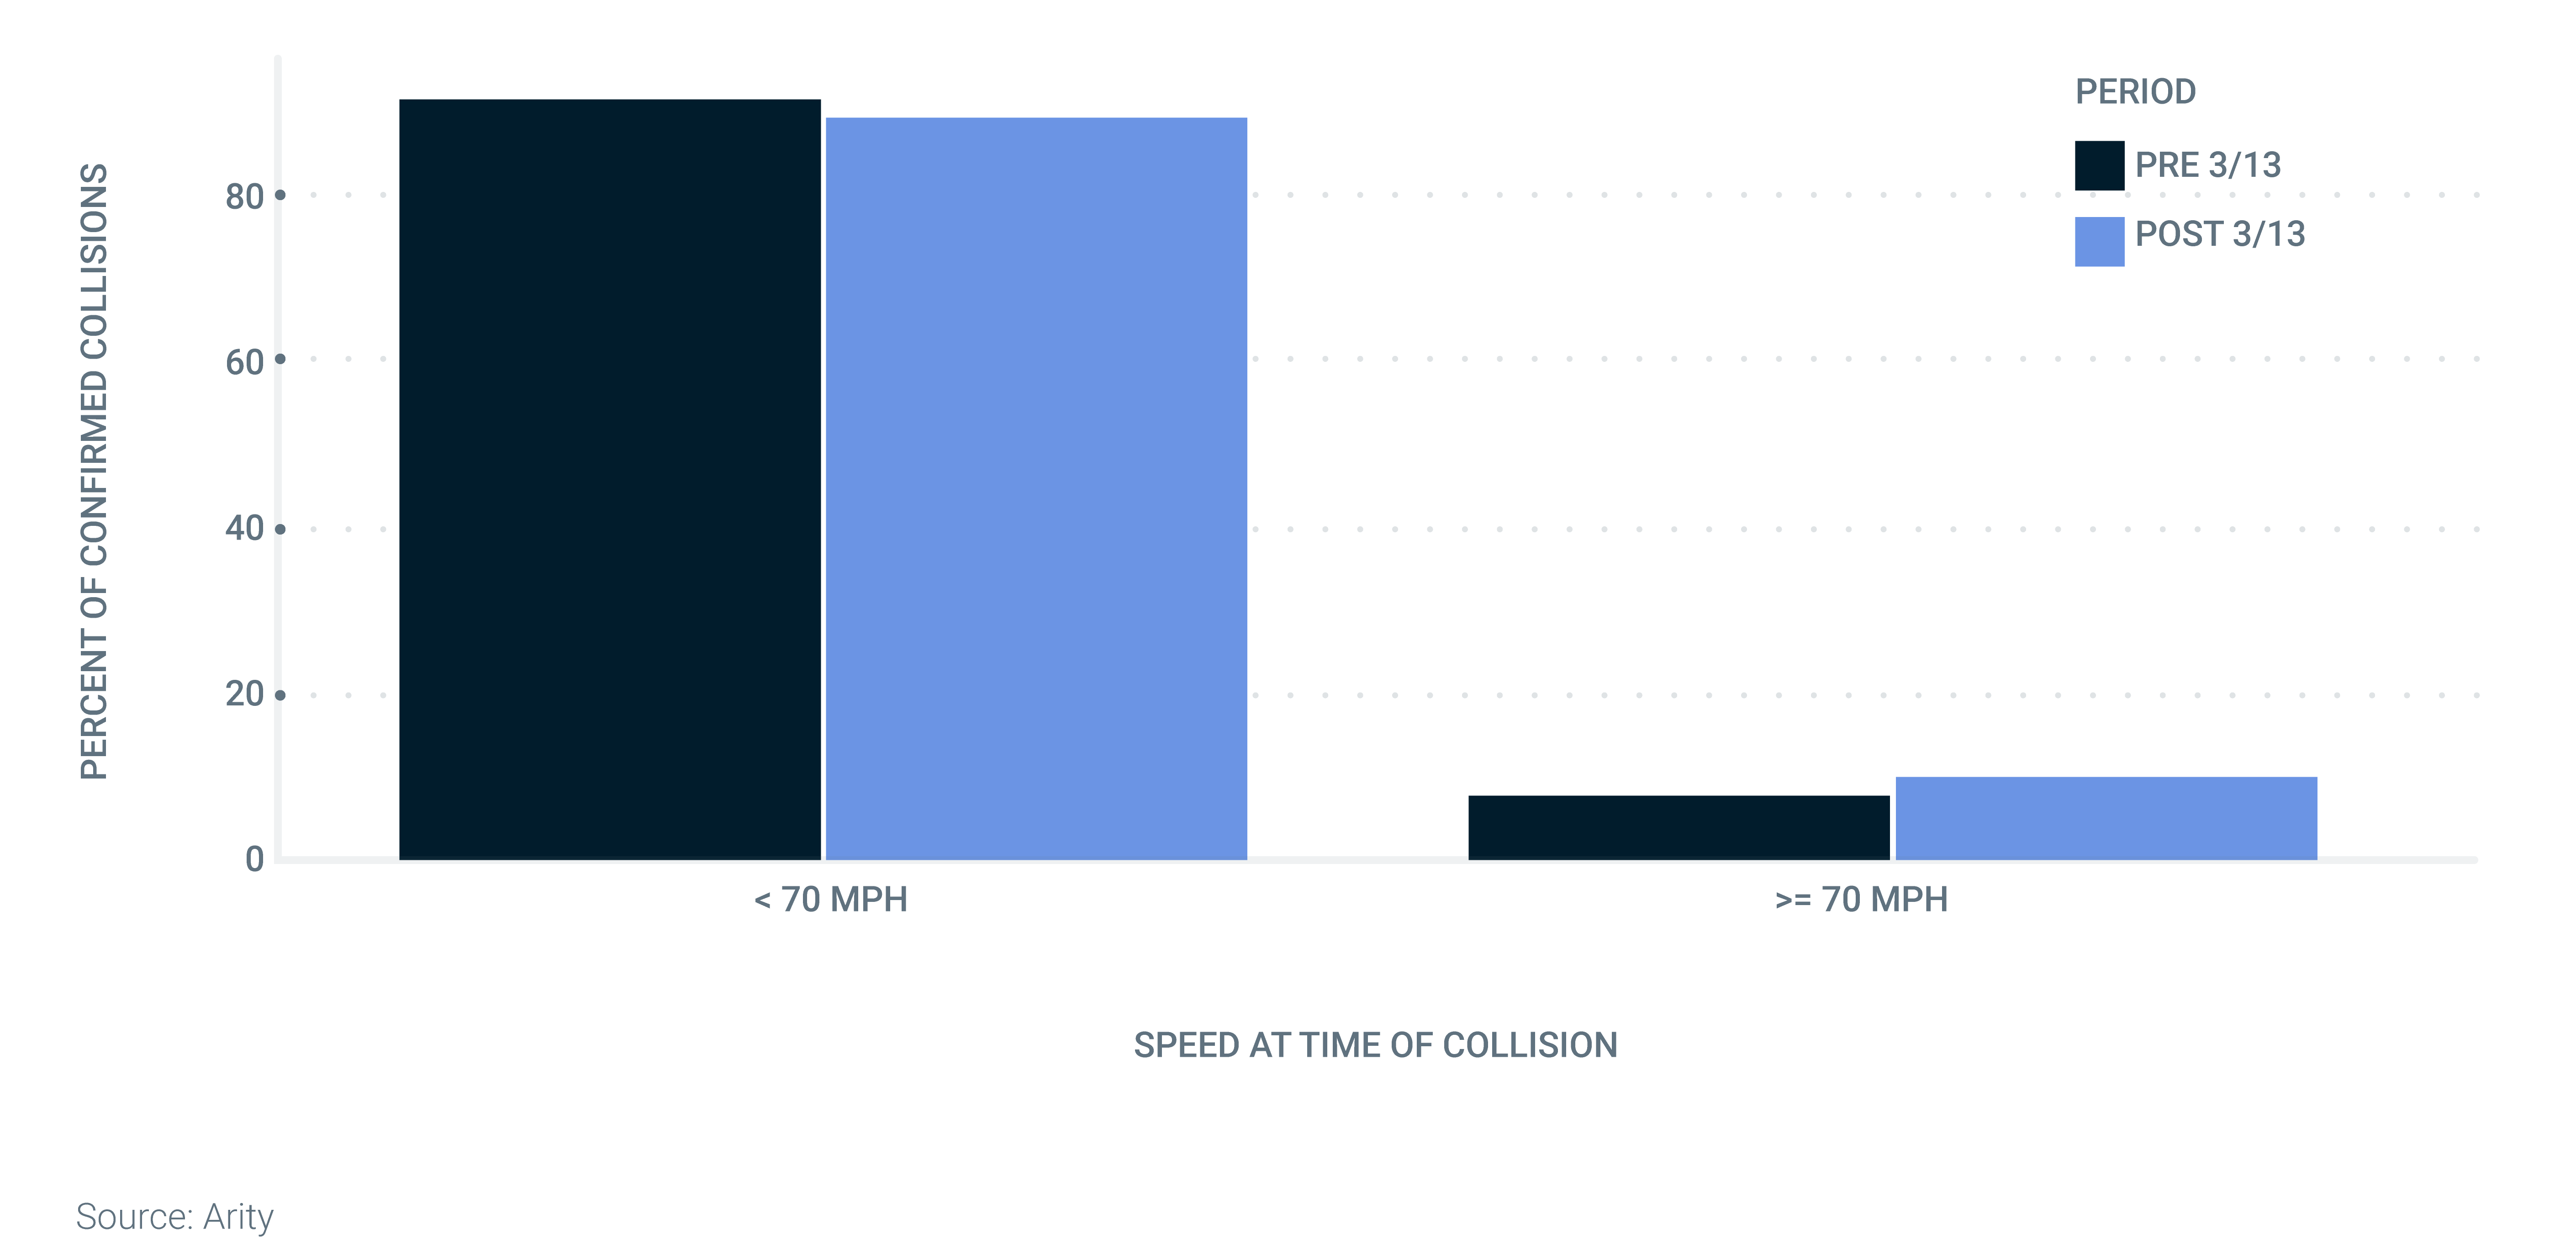
Going beyond predicting driving risk, Arity also measures some outcomes directly. The Arity crash detection service uses machine learning algorithms and sensors on mobile phones to detect potential crashes. Arity customers use crash detection to alert friends, family and, sometimes, emergency services of potential accidents. For this analysis, we used the data from the crash detection service to see how the frequency and severity of crashes has been affected amid driver behavior change.
Unfortunately, the percent of high–speed crashes is increasing. This is important because we know crashes at higher speeds are more dangerous than those at low speeds and typically result in more injuries and damage. This is one possible cause for the 14% increase in the fatality rate per mile recently reported by the National Safety Council.
As people return to pre-COVID-19 driving levels, we must watch whether their driving behaviors also return to previous levels. This will be a crucial insight in order to stay on top of the actual outcomes that insurers will have to manage.
Stay safe on the roads!