Gas prices impact spending: What mobility data reveals early Read article
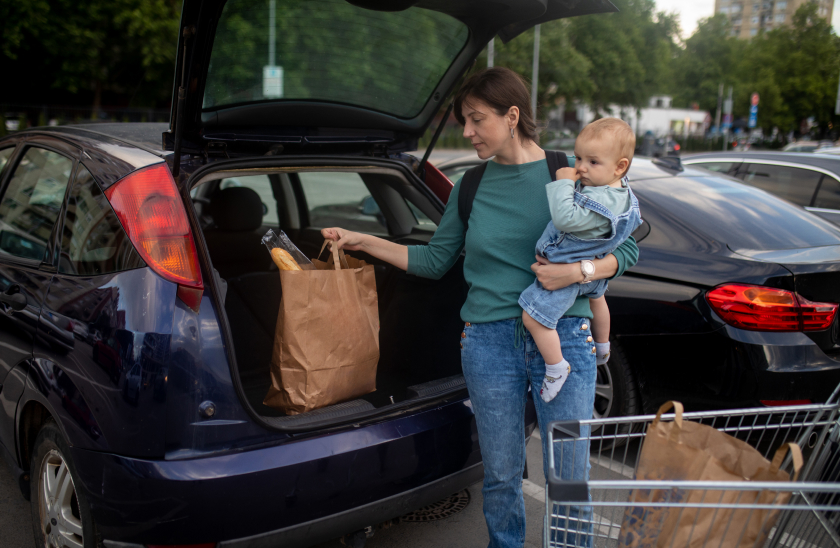
Driving behavior patterns have changed so quickly. Roads across the U.S. have been remarkably empty for weeks as a result of the COVID-19 pandemic. We first shared that miles driven dropped by more than 50% in late March,* with people taking fewer and shorter trips even before shelter-in-place and stay-at-home orders were issued.
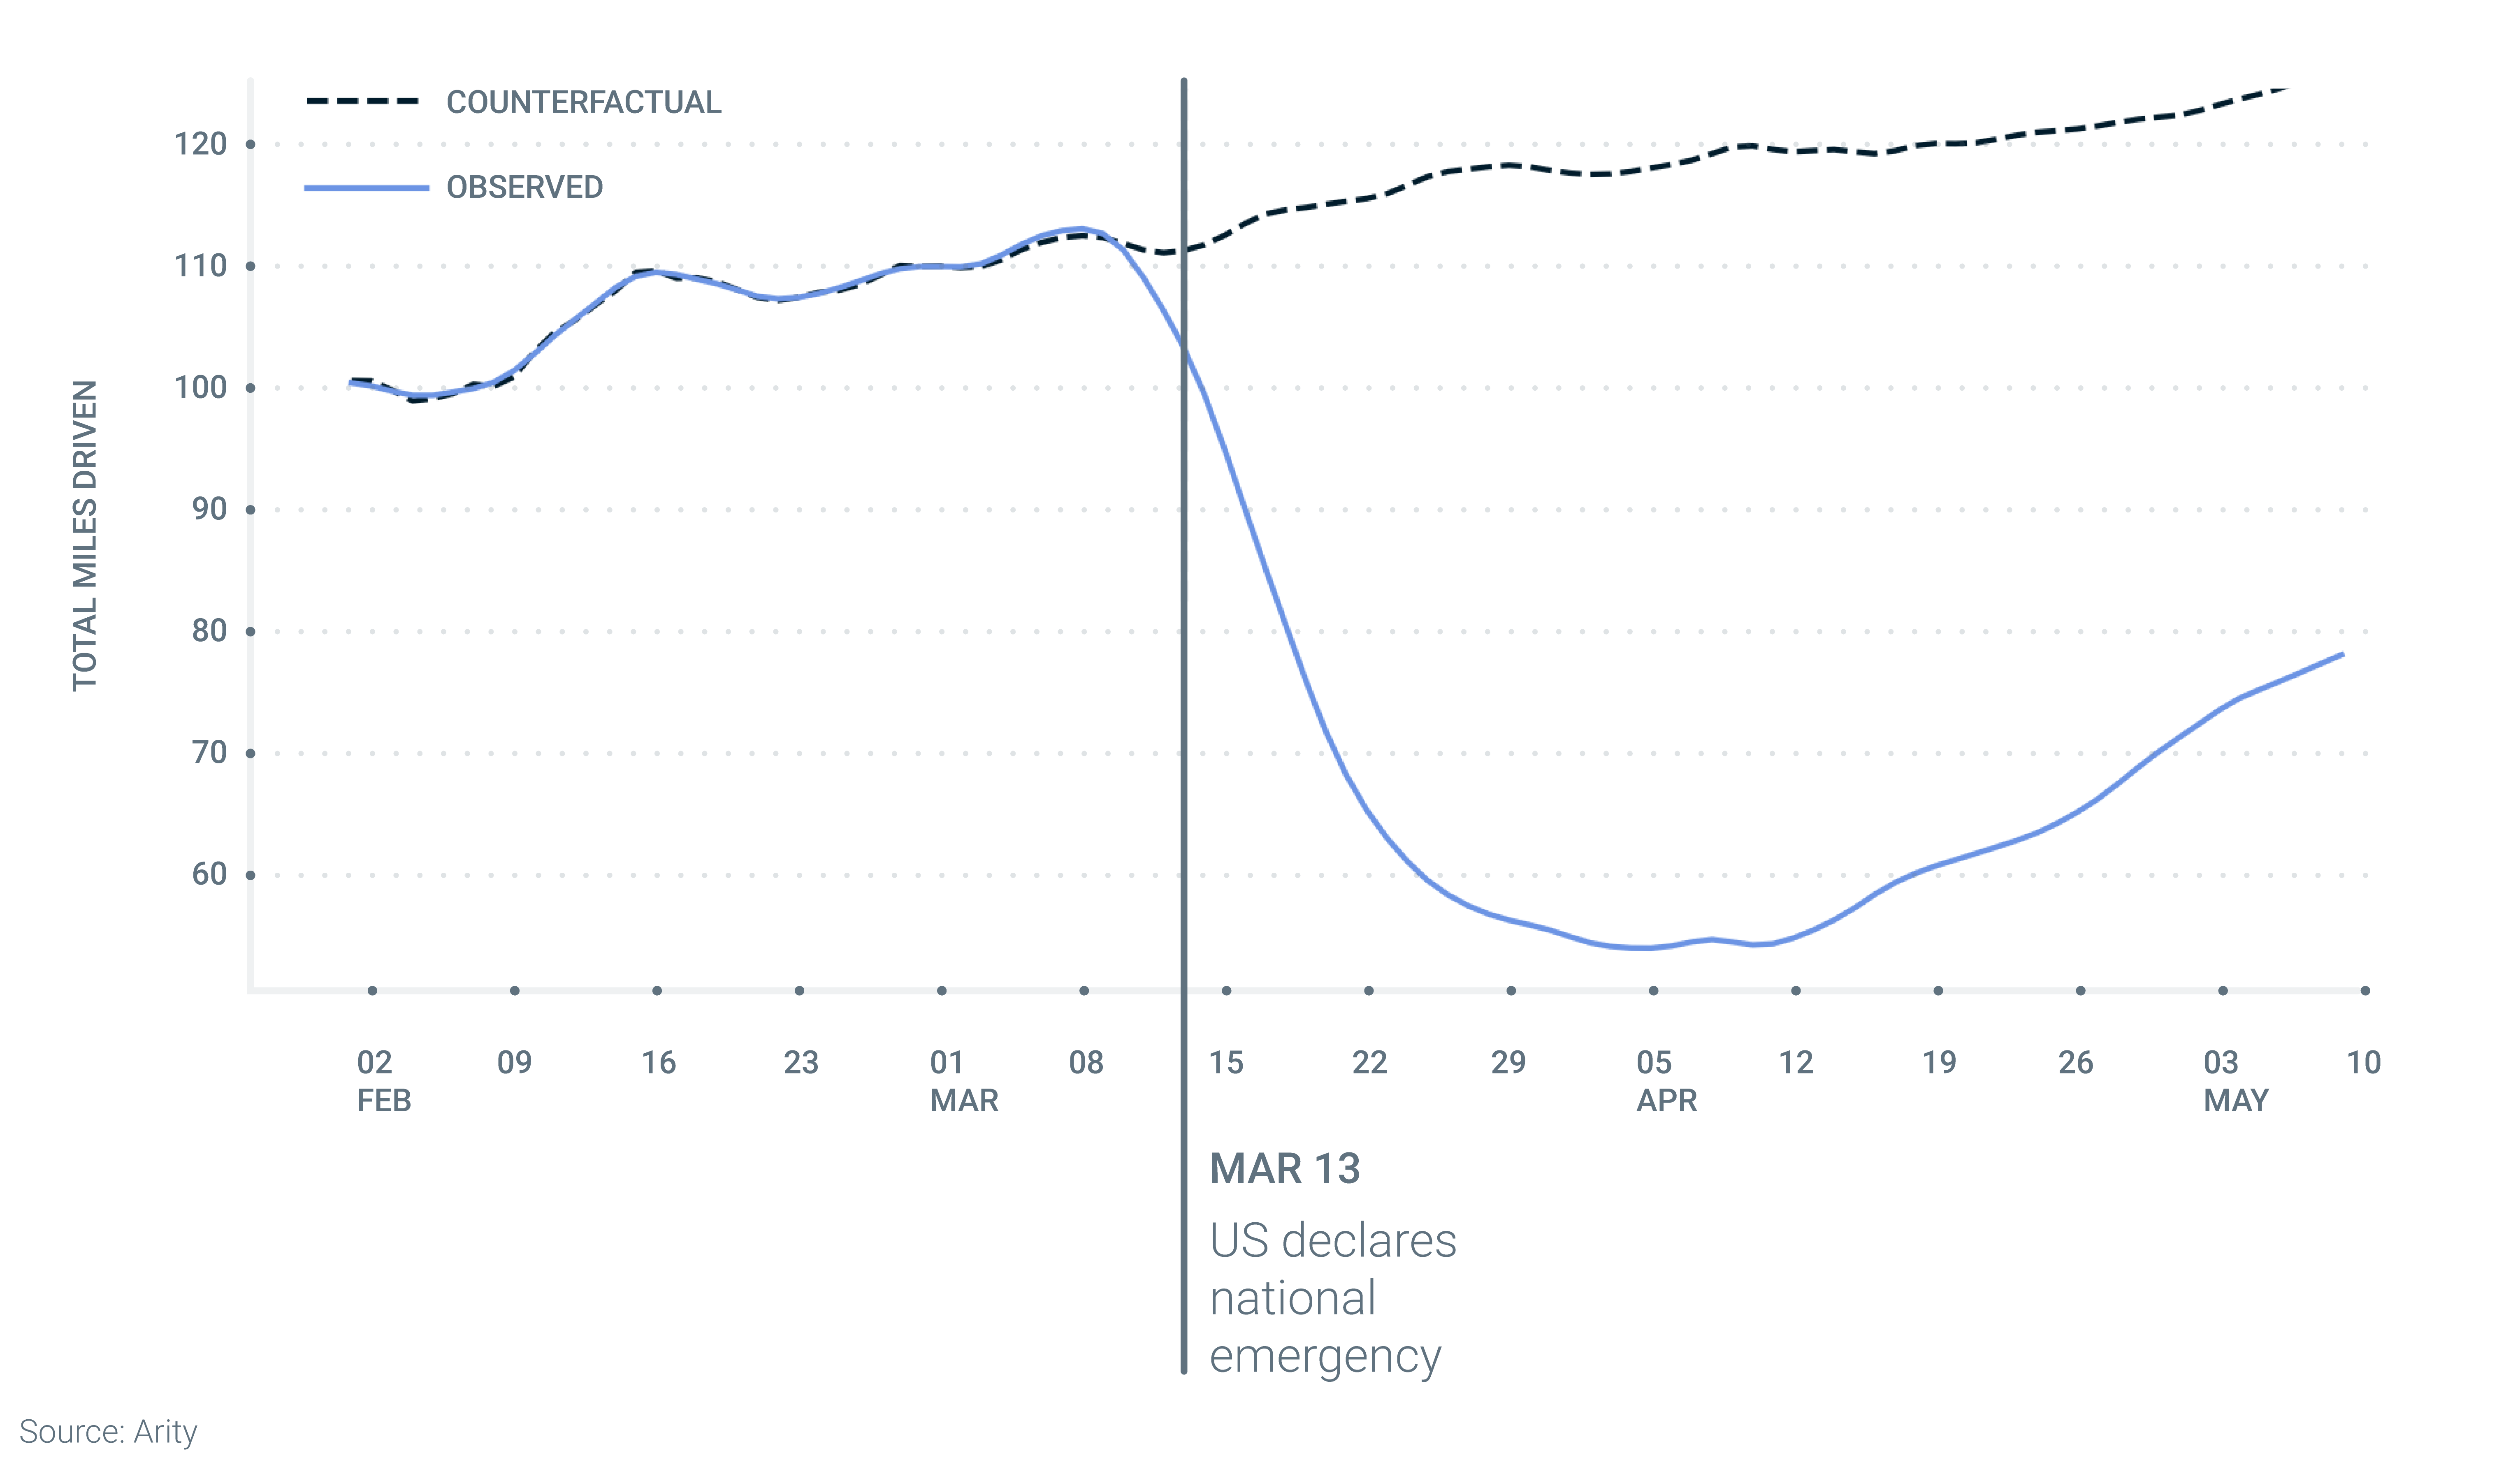
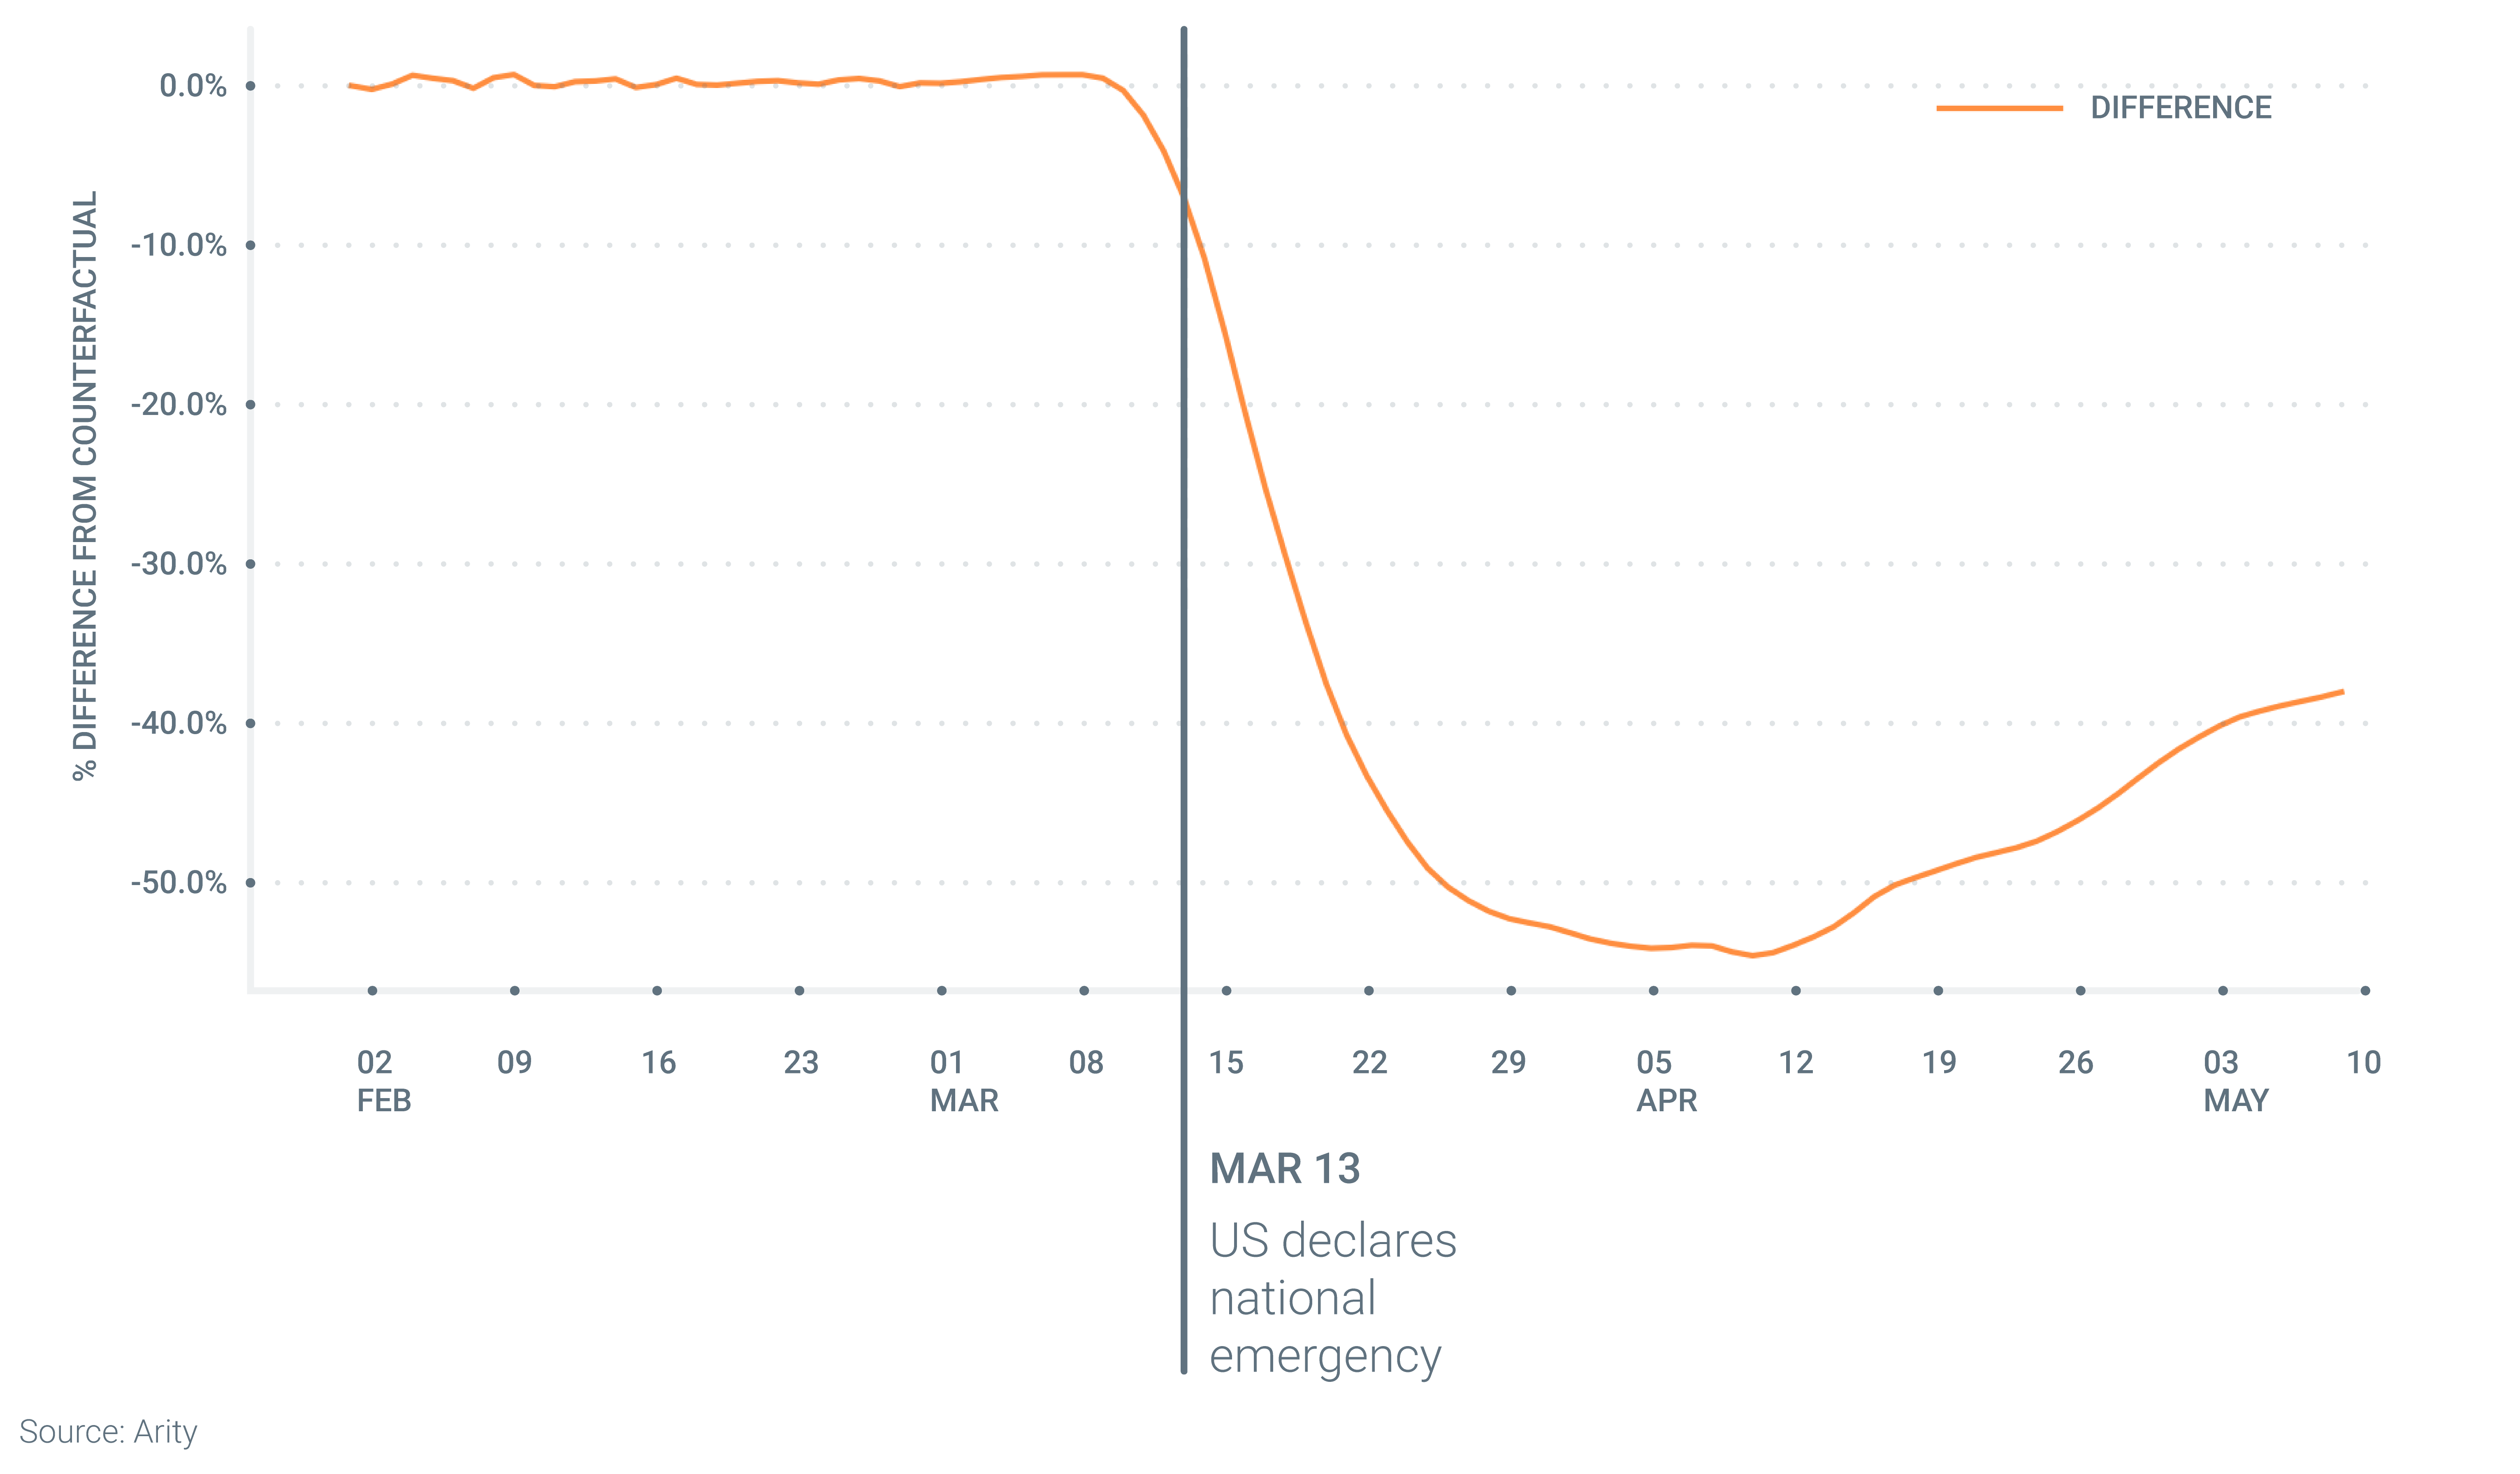
The latest driving pattern analytics show driving remains well below pre-COVID pandemic levels – down 38% across the country as of May 9, 2020. But the number of cars on the road is starting to climb. We expect to see driving increase this time of year as the weather improves – represented by the dashed line in the chart below – but we are seeing increases at rates above and beyond that as people restart some activities.
We have all been affected by the pandemic in some way, but how we have all been affected varies. Some of us are busier than ever because we are working in hospitals or delivering food. Others of us are barely leaving the house. Driving pattern analytics reveal that different parts of the country responded differently to the pandemic. Here is a view of total miles driven broken out by state.
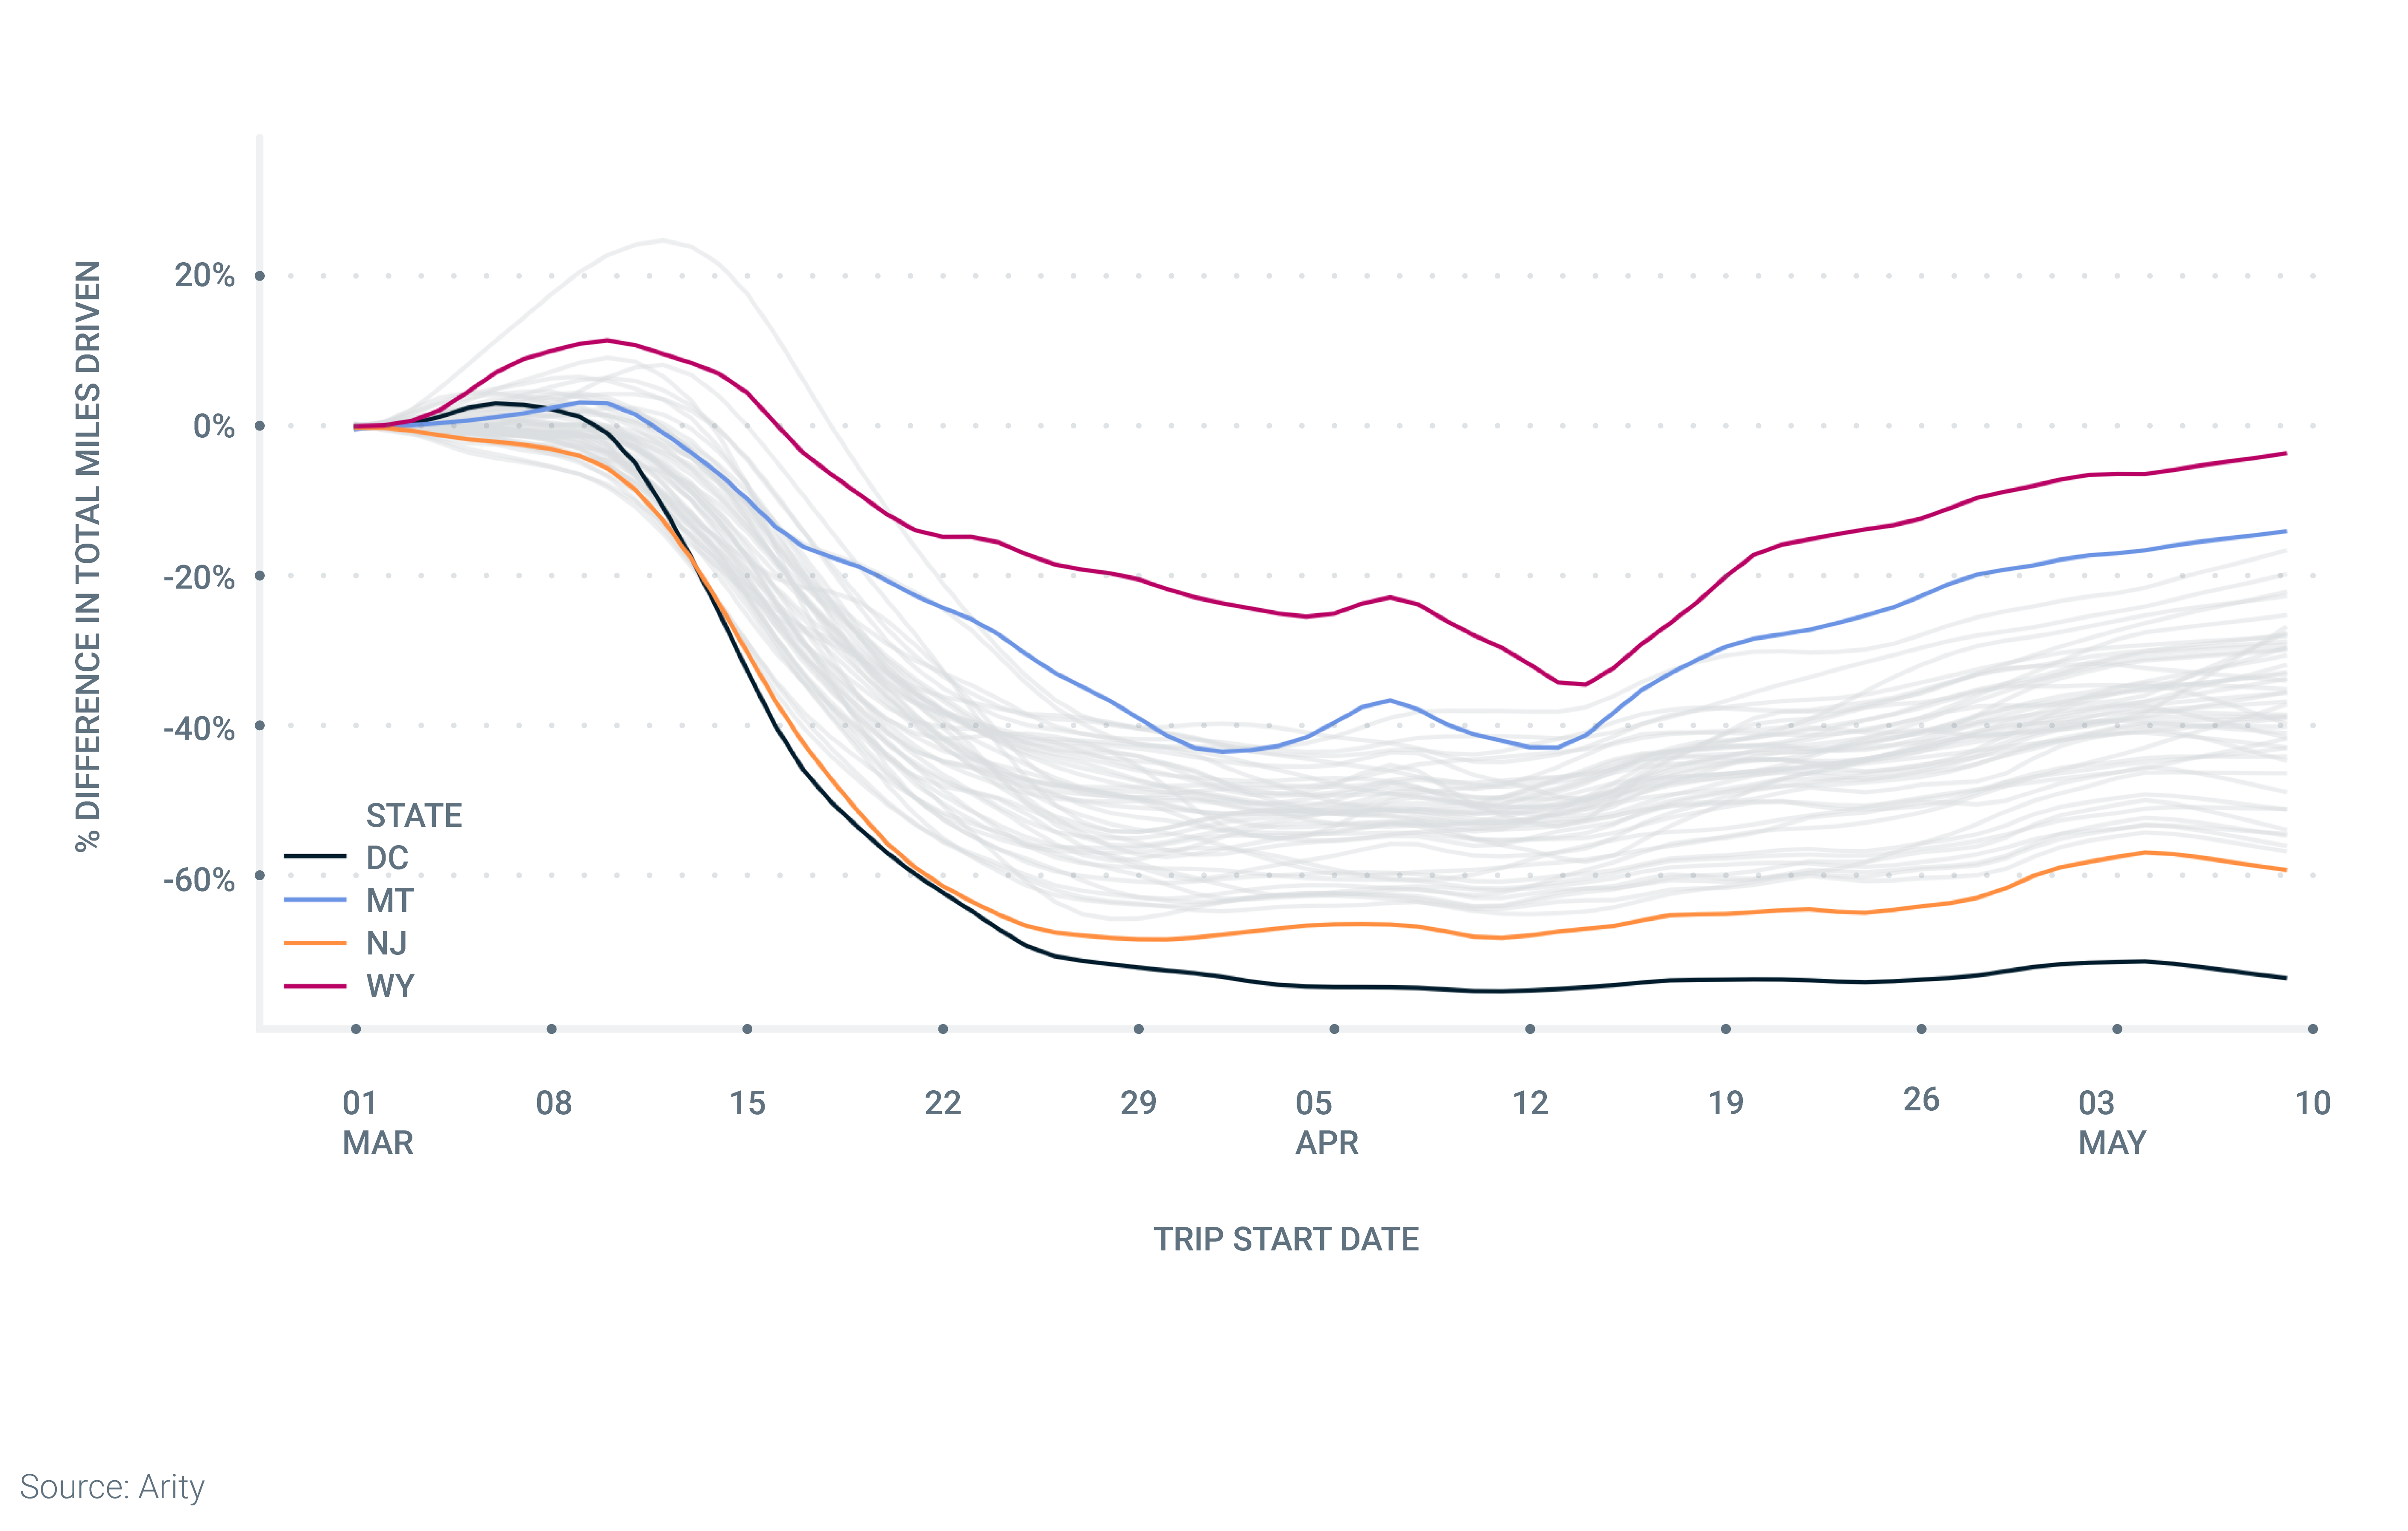
As you can see, while many states responded to the onset of the pandemic at roughly the same time, there were differences in how much their residents reduced their driving. These differences have only widened over time so that now some states are still down over 50% while other states have nearly returned to pre-COVID normal.
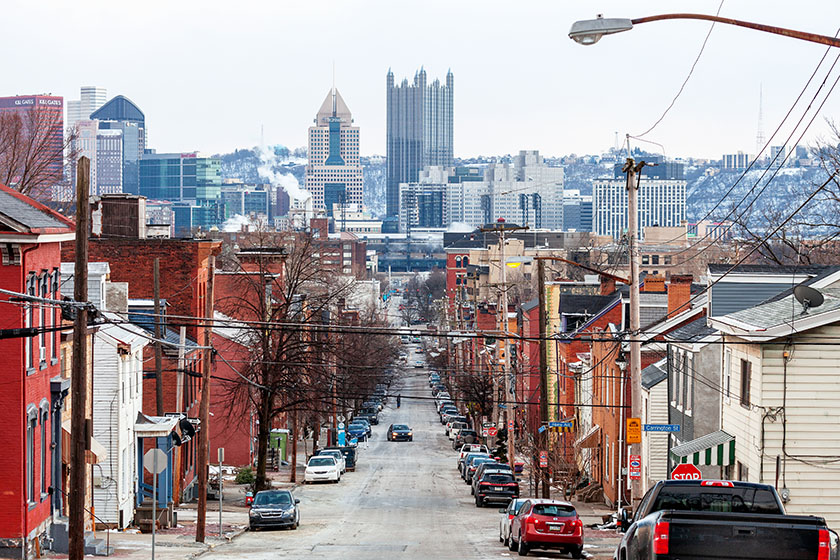
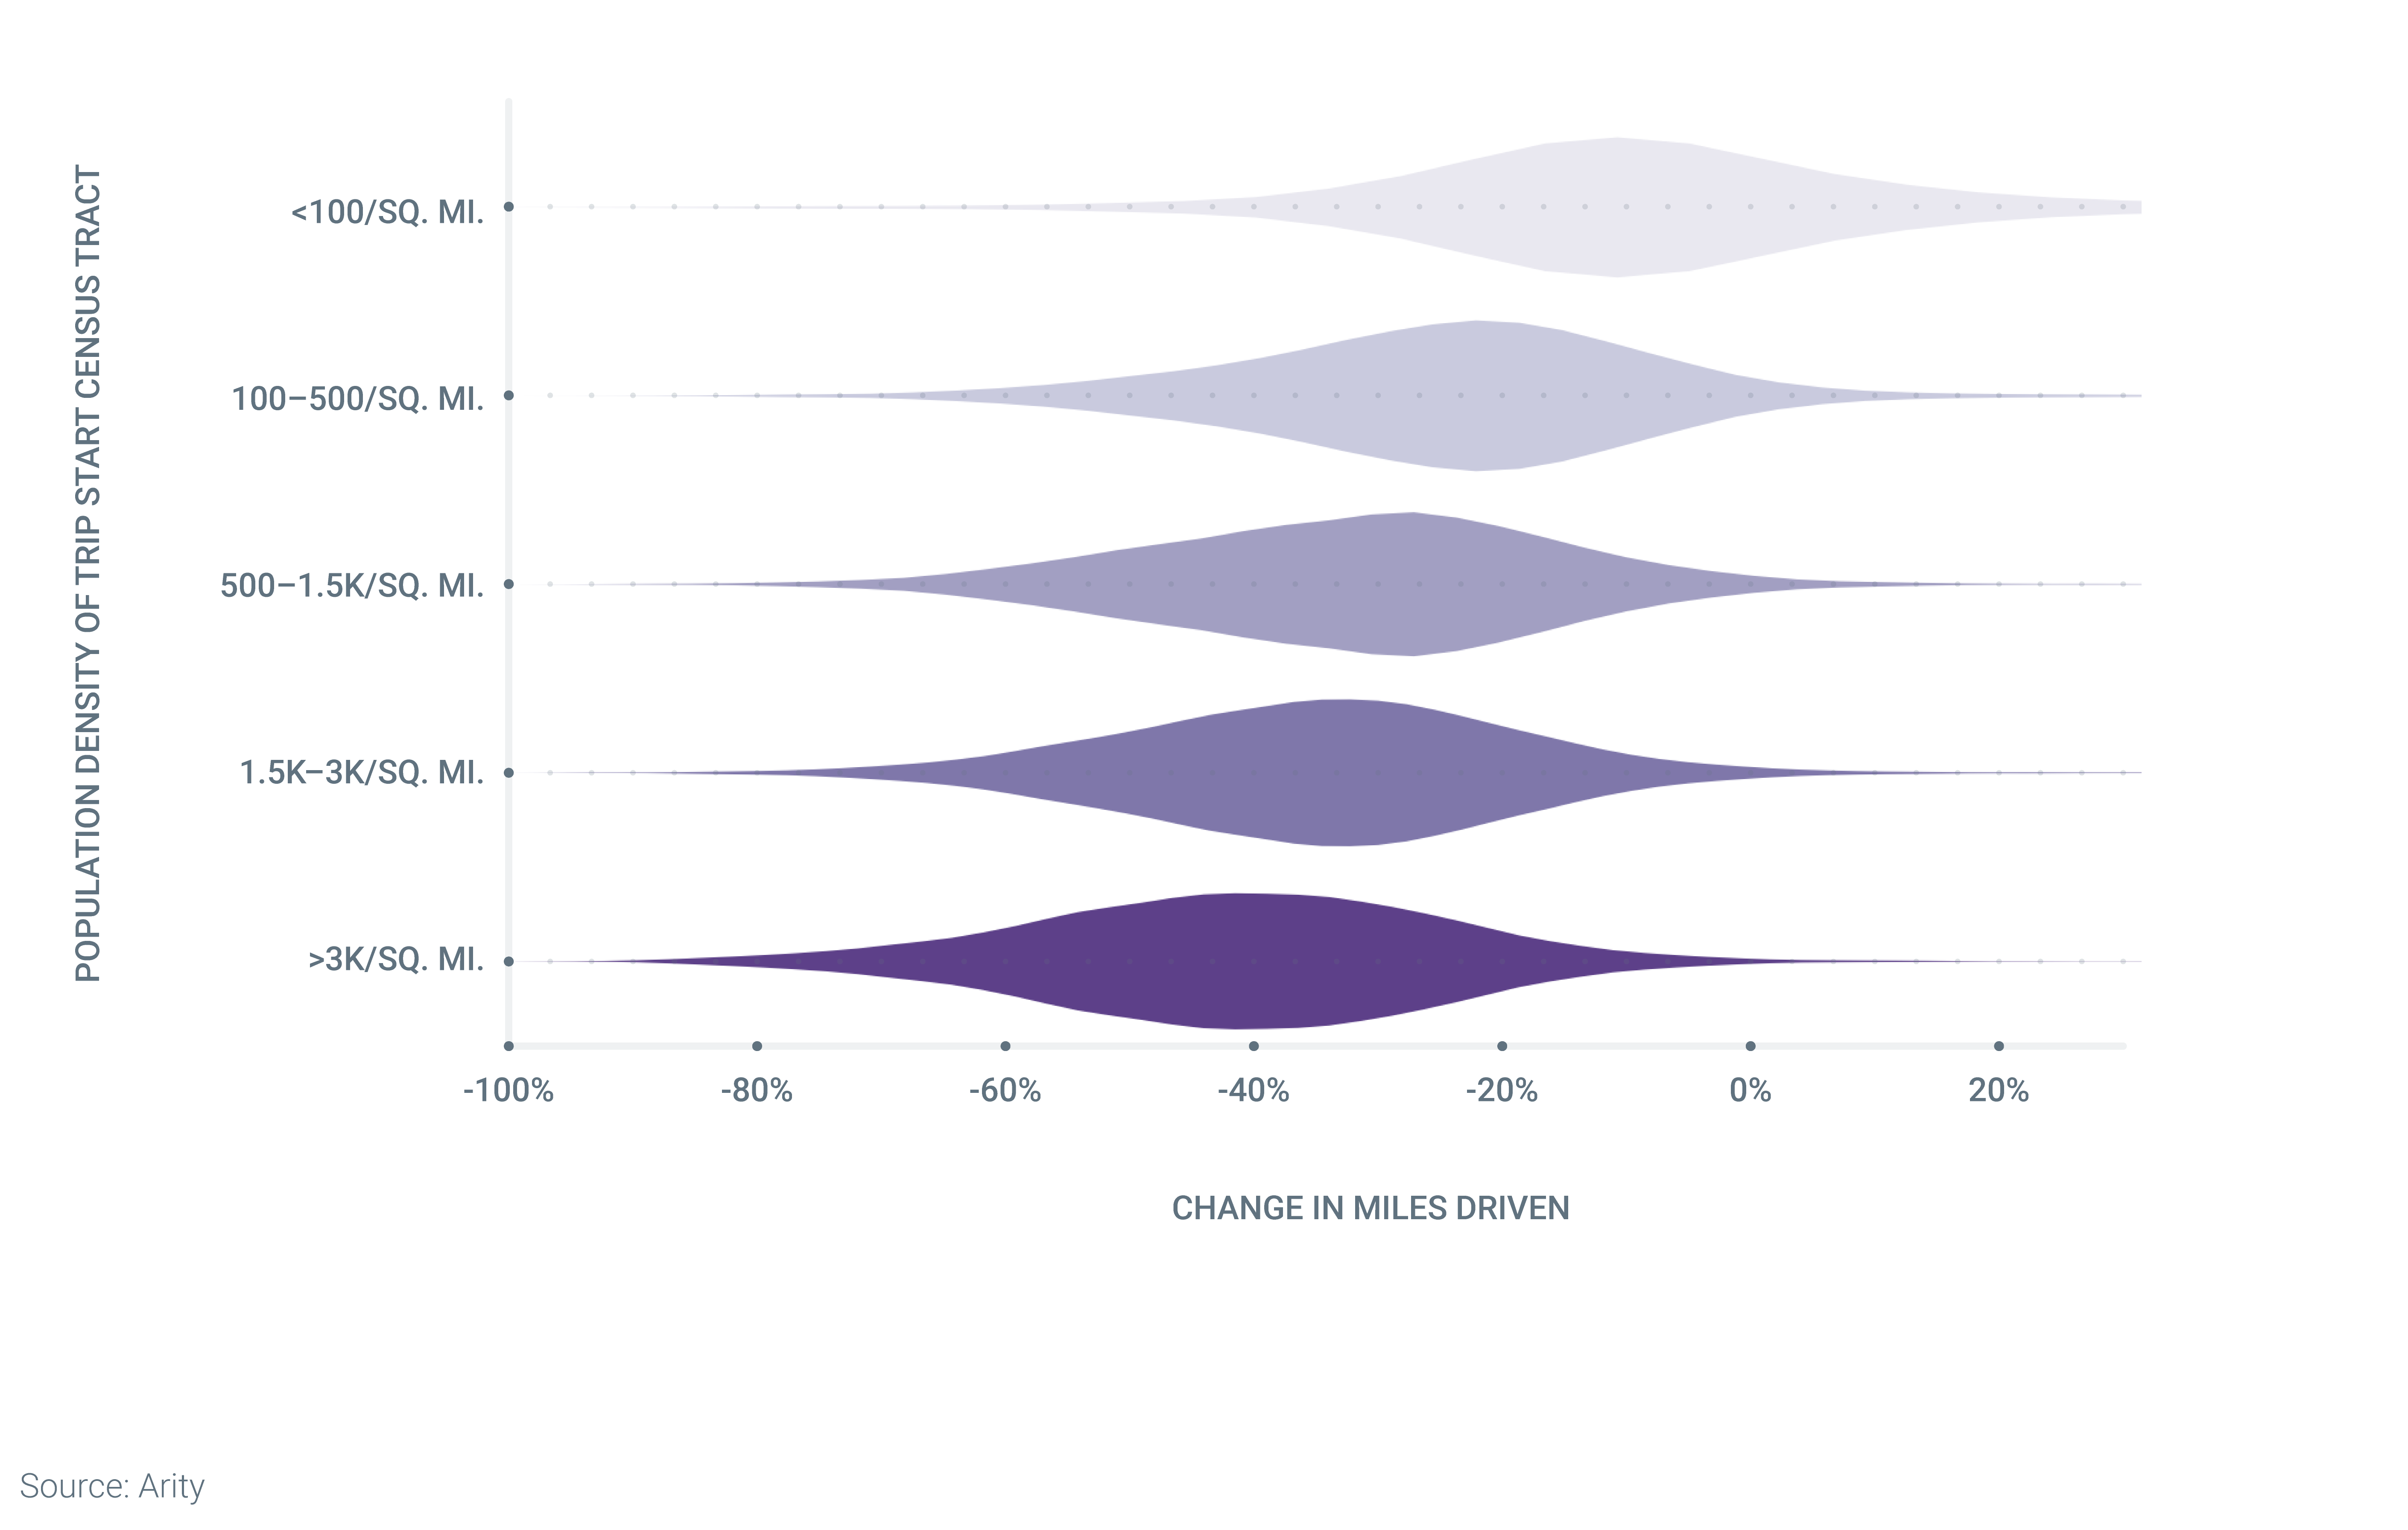
What is causing these differences in driving reduction? One factor is how densely populated an area is. Population-dense cities were hit hardest early in the pandemic. In the chart below we have grouped trips by the population density of their starting point. Driving in the highest density areas is down more than driving in the lowest density areas. In fact, over a quarter of drivers in less densely populated areas are driving more last week than they were in early February.
Driving in the highest density areas is down more than driving in the lowest density areas.
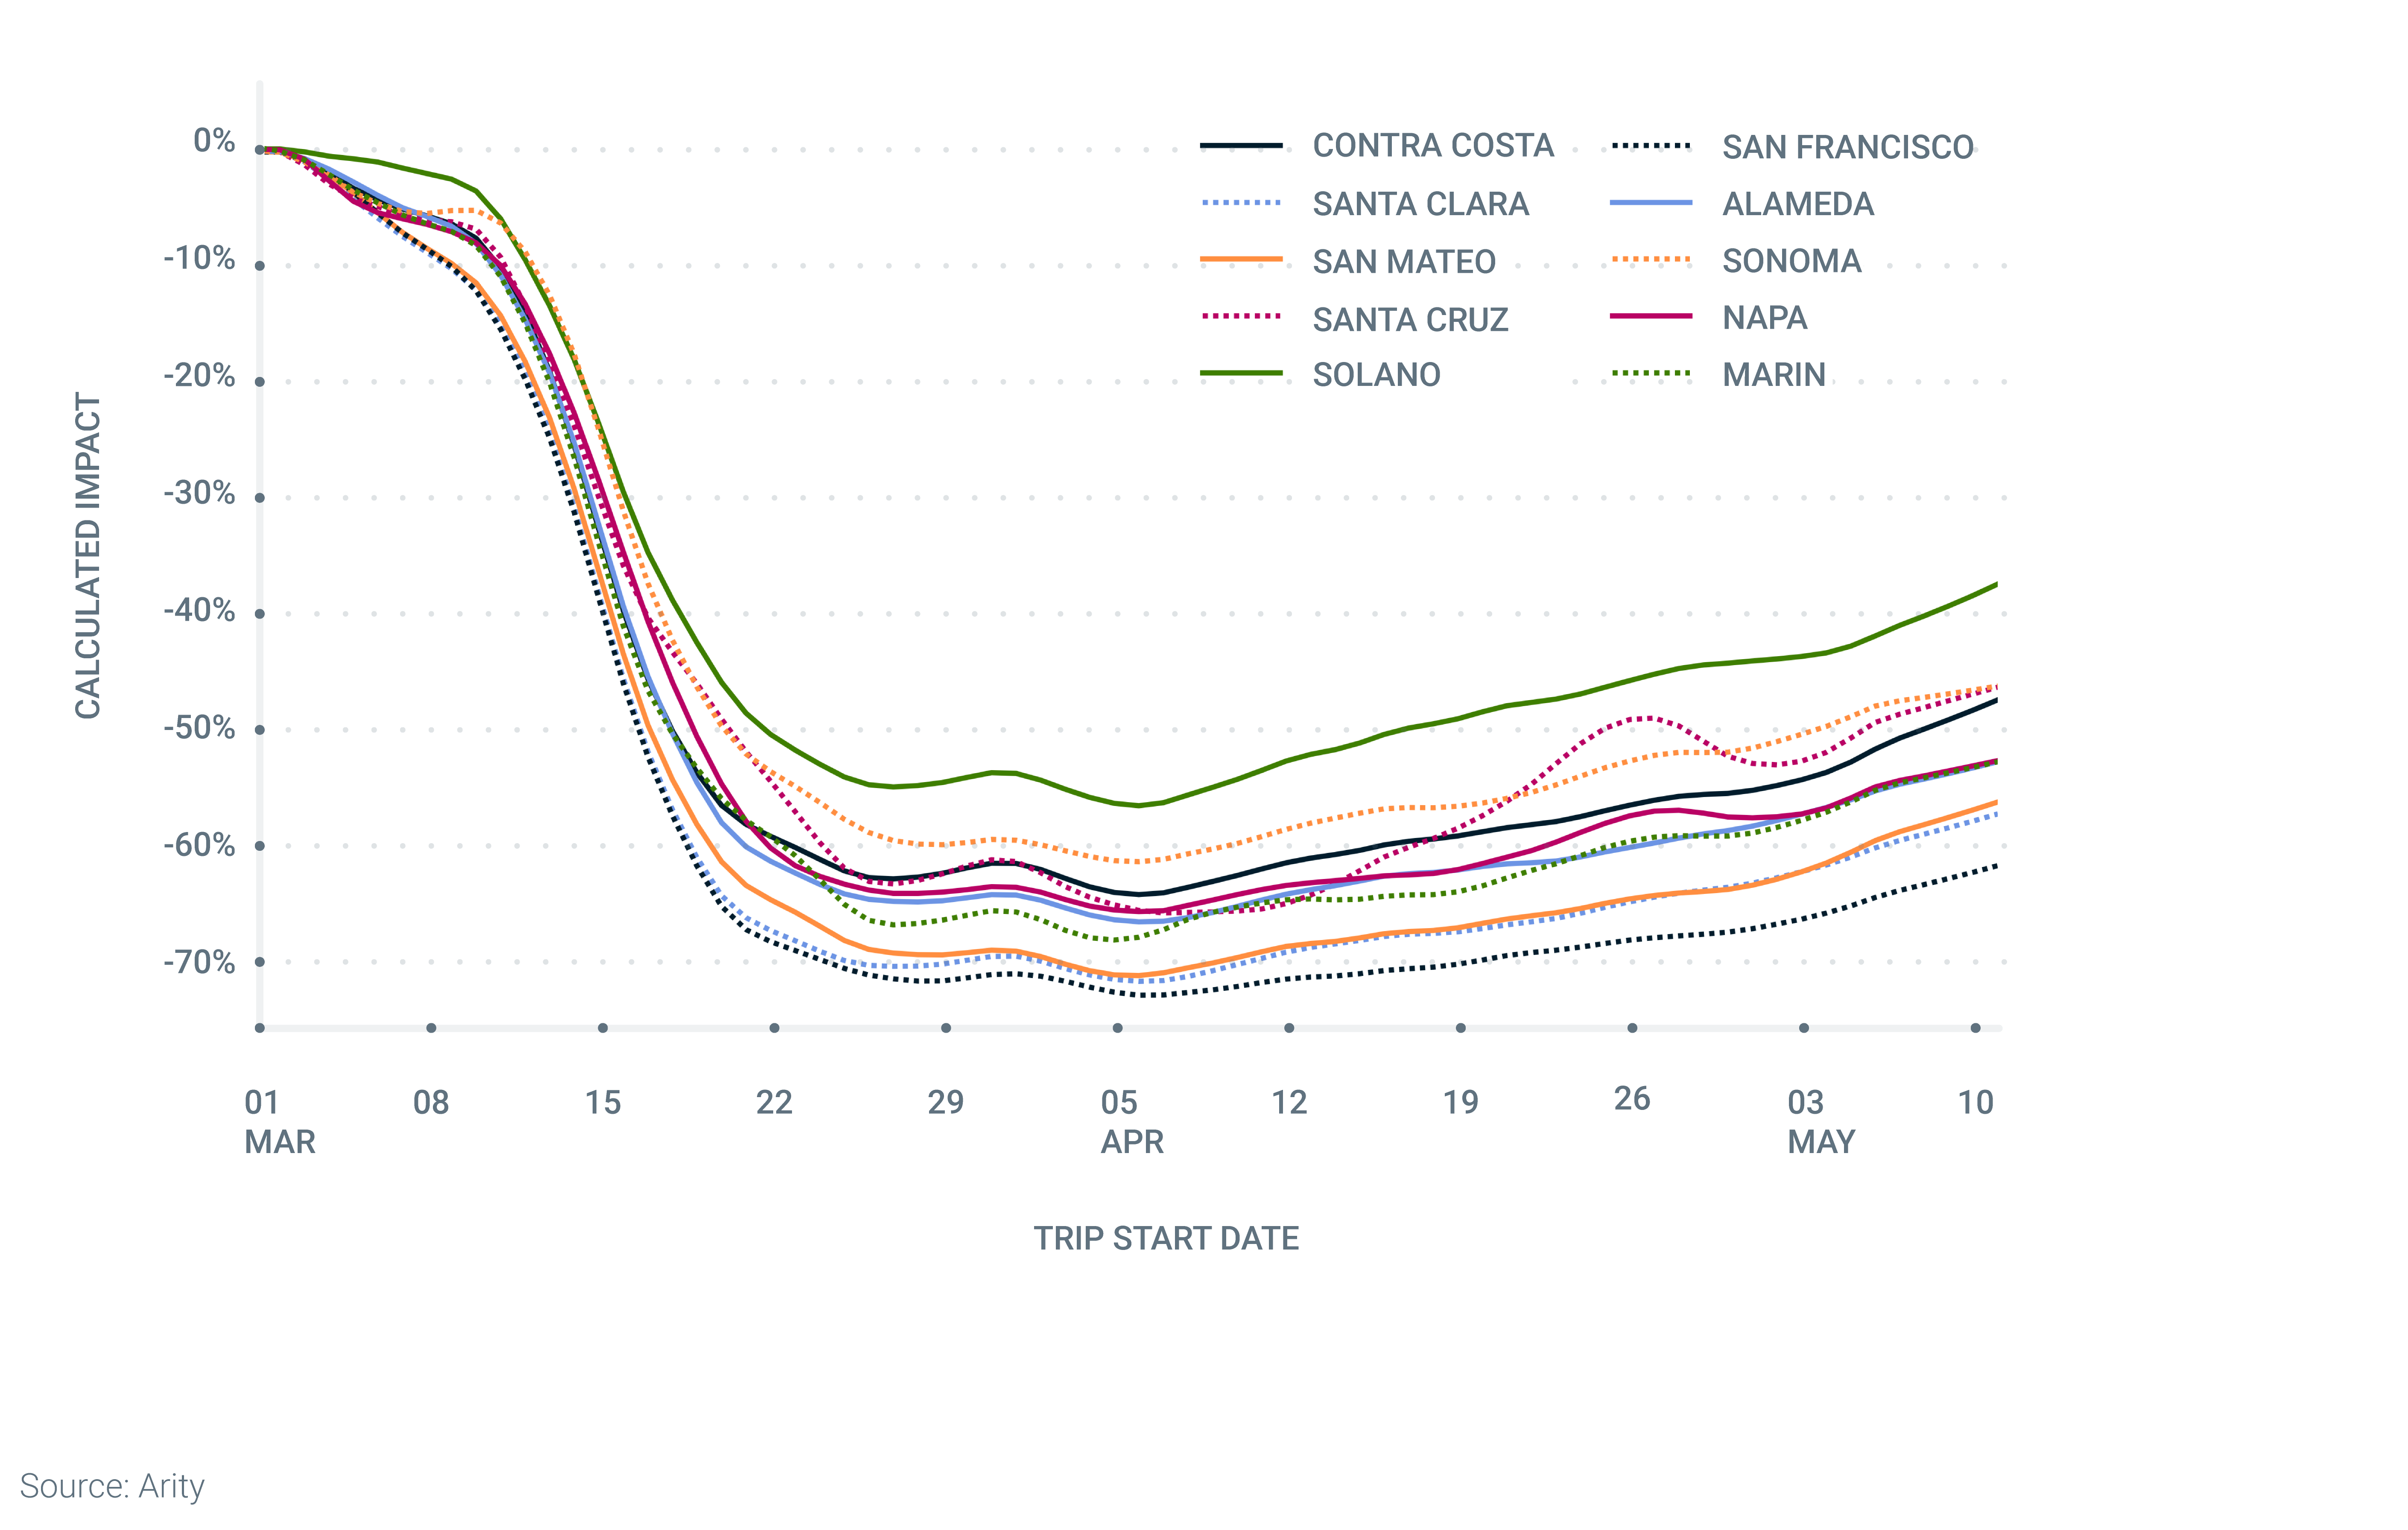
This trend remains true in counties close to each other. Transportation data from California’s Bay Area shows that driving is down nearly 62% in San Francisco, compared to a 38% decrease in nearby Solano.
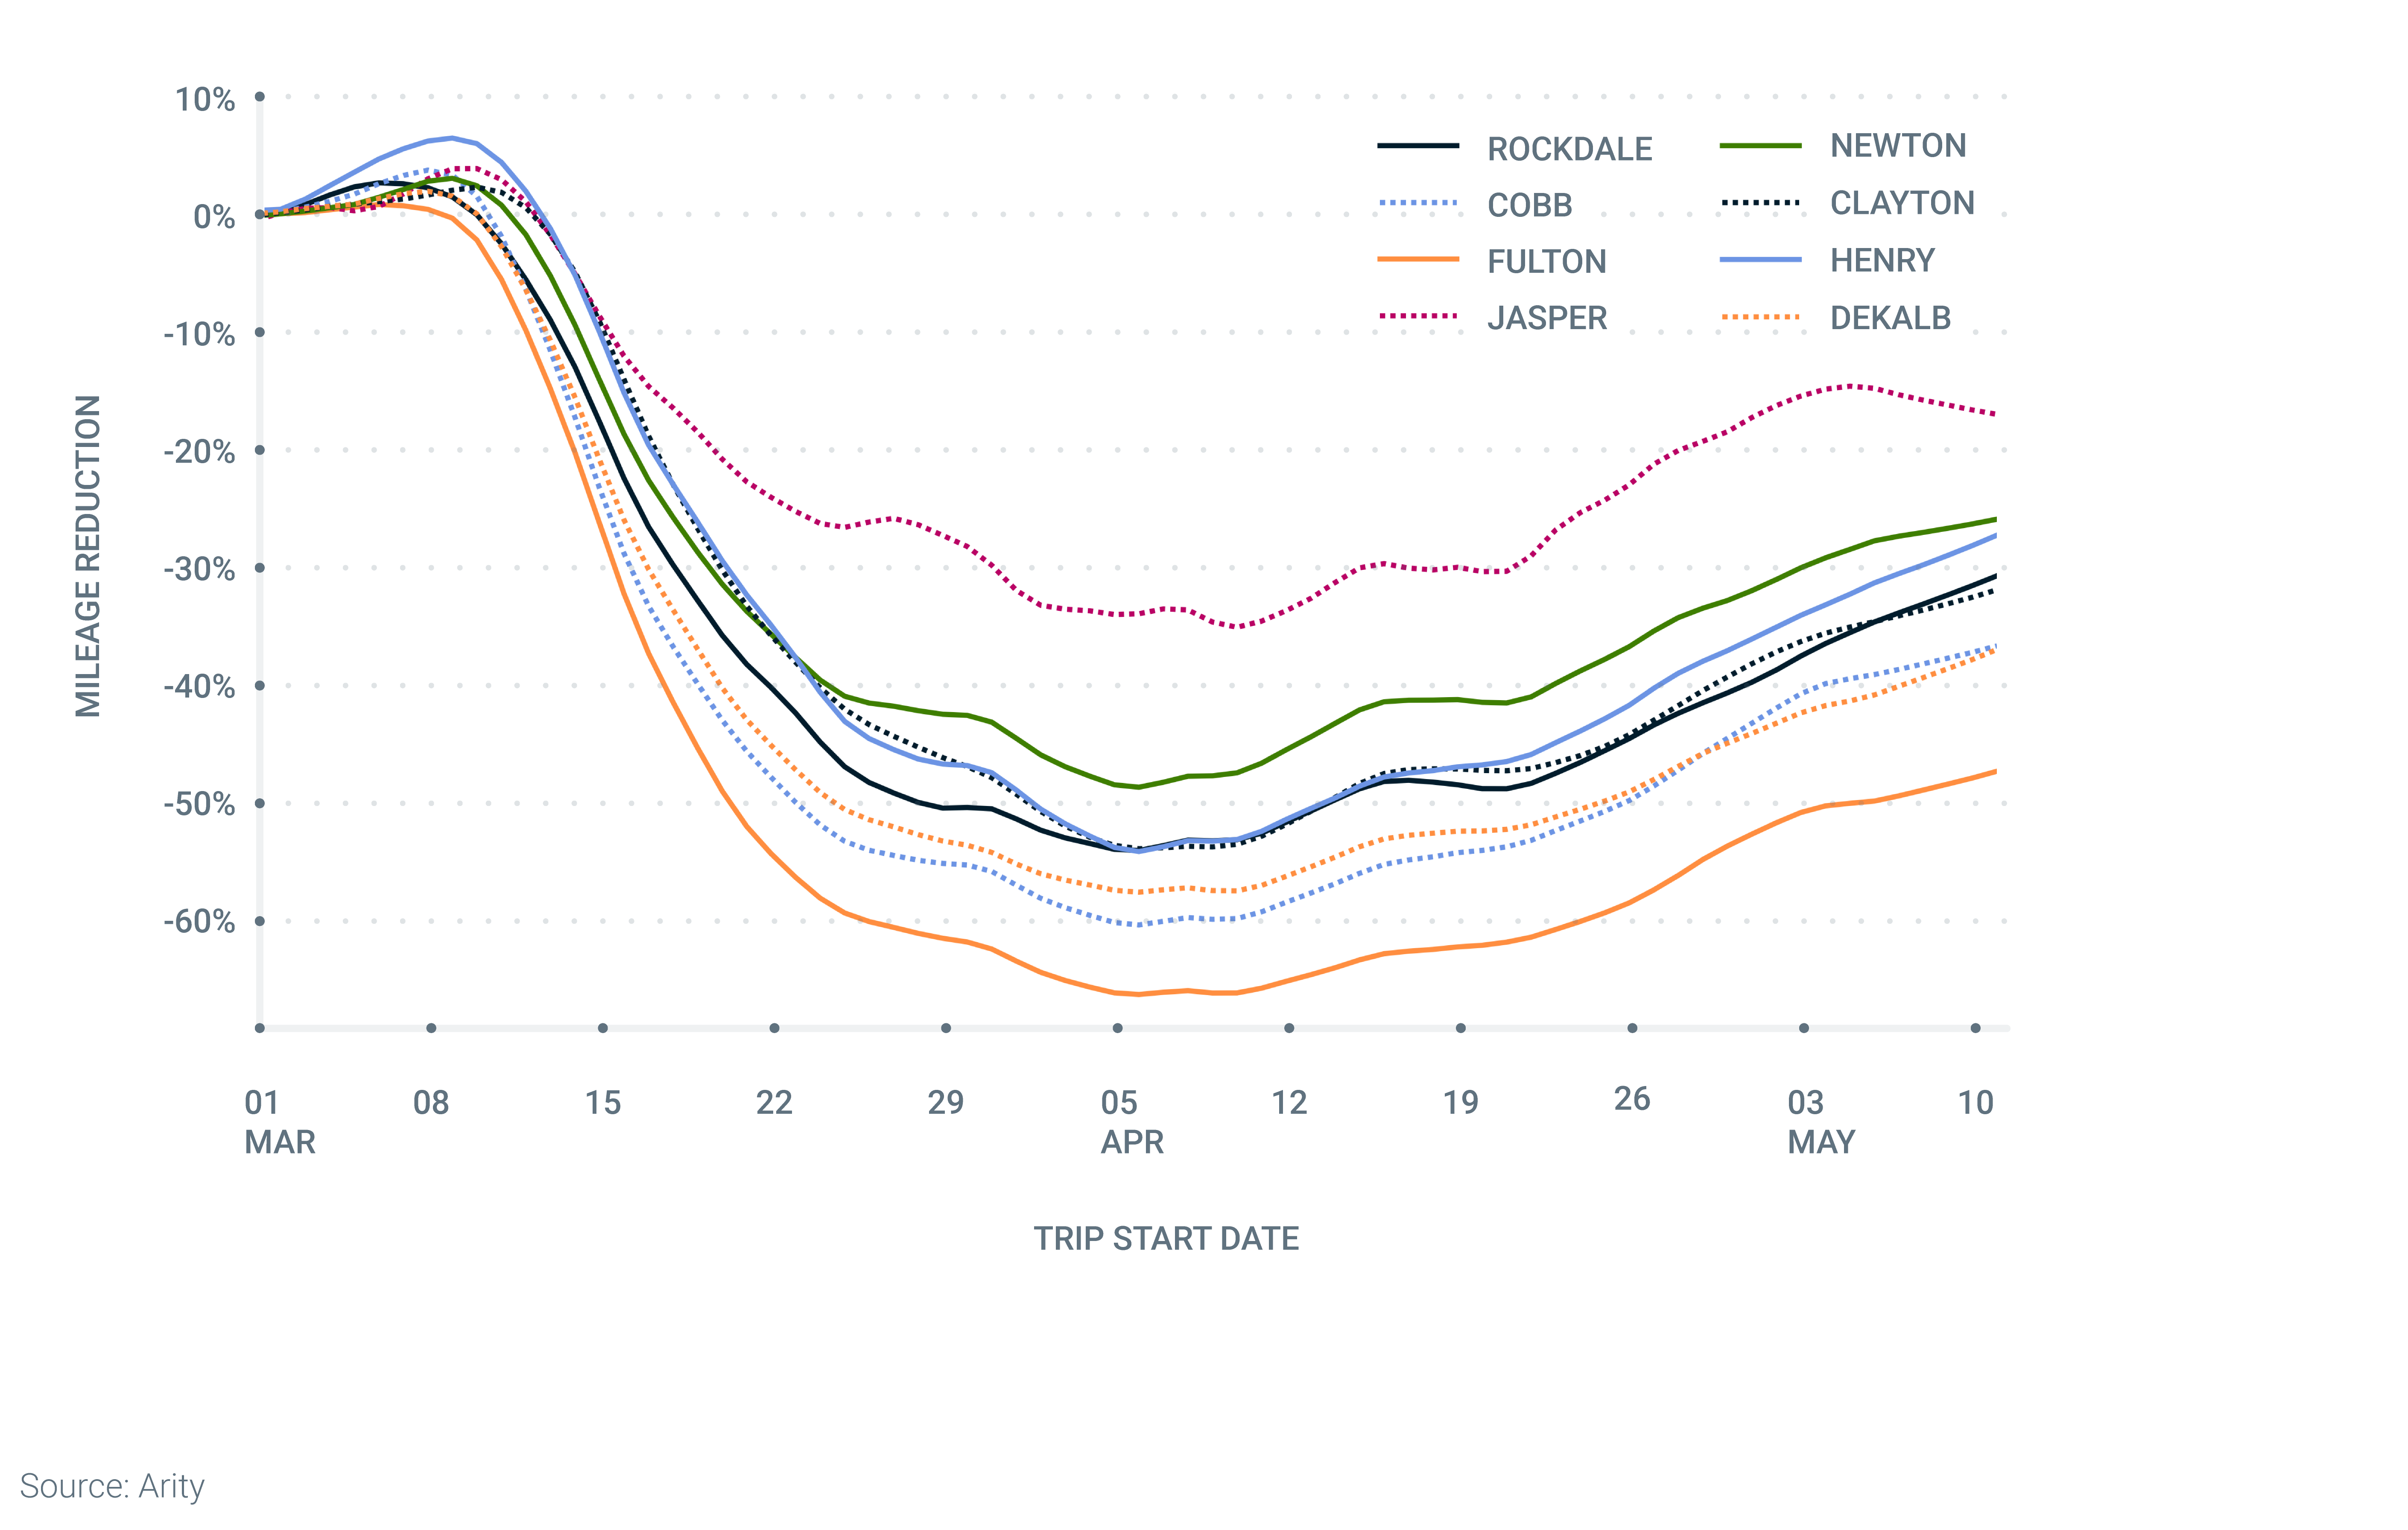
Driving in Georgia has increased over the past few weeks, making it one of the ten states in which residents are driving the most. While Georgia’s residents are still driving 28% less relative to expected levels, we also see differences based on population density of local communities, Driving pattern analytics show Fulton County, which includes some of Atlanta and its suburbs, is still down 47%. Nearby Jasper county is only down 17% and is trending back towards normal driving levels.
Americans are trying to balance finding a new normal with the ongoing risk of infection. As much as we want to forecast when and where driving will return to pre-pandemic levels, it’s still too early to tell. Explore what our data is telling us about how driving levels and behaviors are shifting as the pandemic continues.
Stay safe!
*To develop these insights, Arity leveraged data from Arity’s multi-source dataset. That dataset includes anonymized and aggregated driving behavior data from insurance and non-insurance sources and is not solely reflective of any particular industry or source. The data are collected from mobile app and on-board device methods.