Mobility data reveals consumer demand shifts when a new grocery store comes to town Read article

We all know not to text and drive, yet Arity data shows that we’re doing it more than ever.
As part of our mission to make transportation safer for everyone, Arity analyzed the driving behavior data contained in our vast mobility dataset to better understand this phenomenon. It’s evident that distracted driving is an epidemic, costing money and lives.
In 2019, distracted driving incidents cost the U.S. $98 billion. While that’s enough to warrant change, the more heartbreaking stat is it also resulted in 10,000 fatalities and over one million nonfatal injuries that same year.
That’s not a price we’re willing to pay.
As with any epidemic, we need to diagnose the disease – where, when, and why it’s happening – before we can stop and prevent it.
Our new report, Crash course: The state of distracted driving in the U.S., reveals key insights that companies, organizations, and individuals need to know to keep our roads, and the people who drive on them, safe:
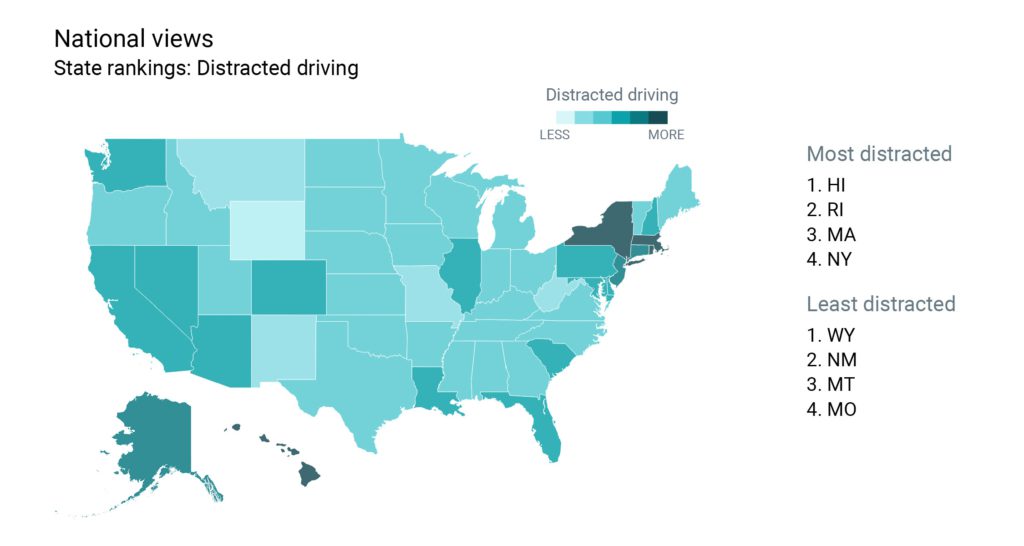

Hawaii, Rhode Island, Massachusetts, and New York
Wyoming, New Mexico, Montana, and Missouri
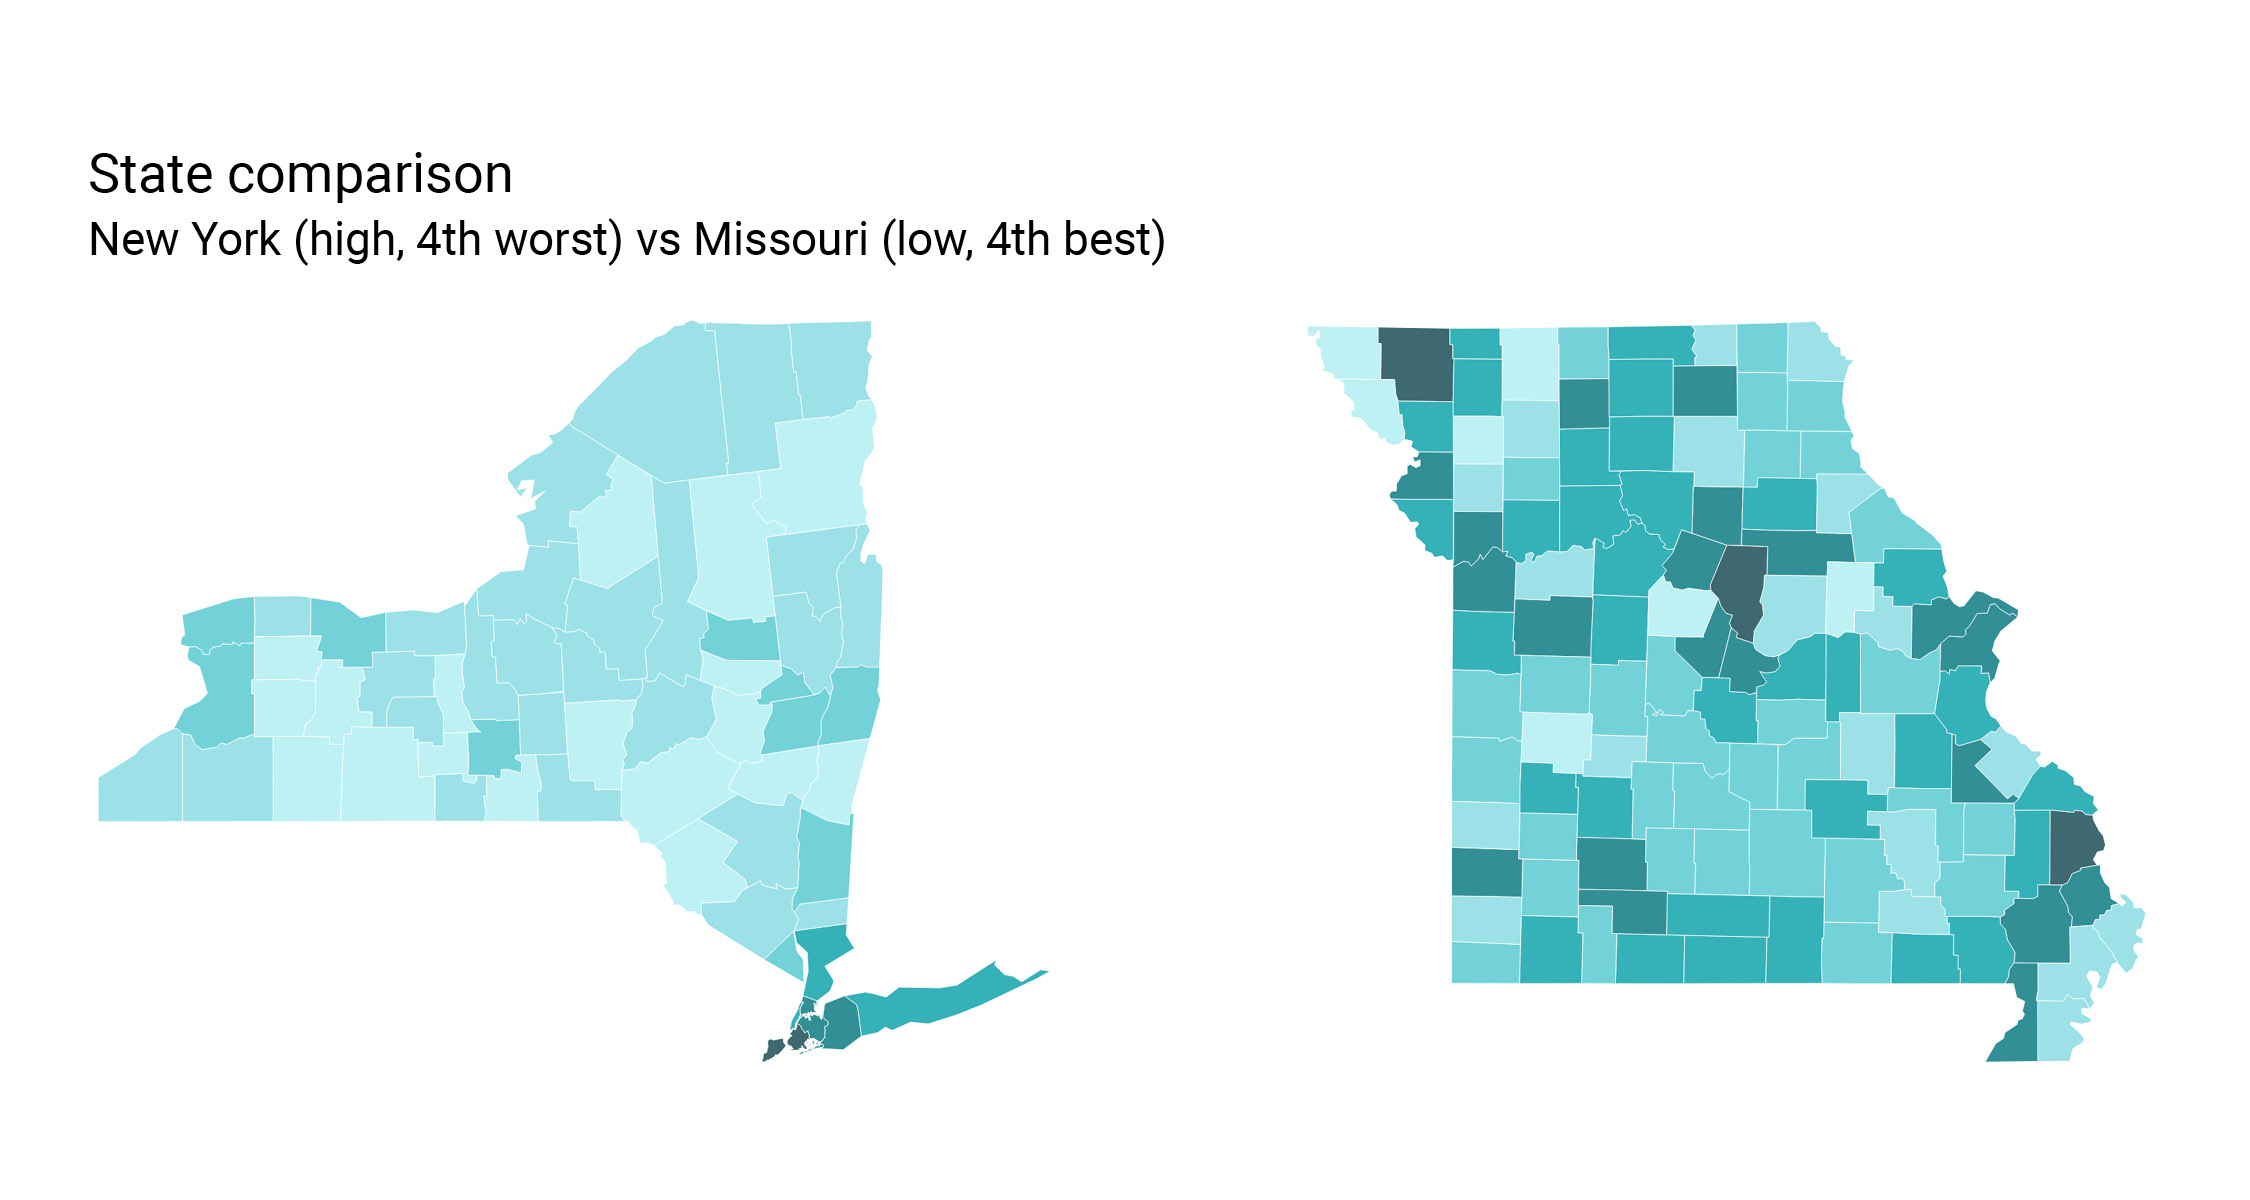
Distracted driving levels not only vary by state – but also by county and zip code. While state-level data on distracted driving may tell one story, the more granular, regional-level data uncovers a whole new narrative.

So, what? We need to know where distracted driving happens to combat it
While distracted driving affects the entire U.S., that level of impact varies state by state and region by region. To start combating this epidemic, everyone – government, businesses, organizations, and the general population – needs to understand how distracted driving affects them locally. With these insights, we will know where to focus our efforts and resources to stop and prevent distracted driving.
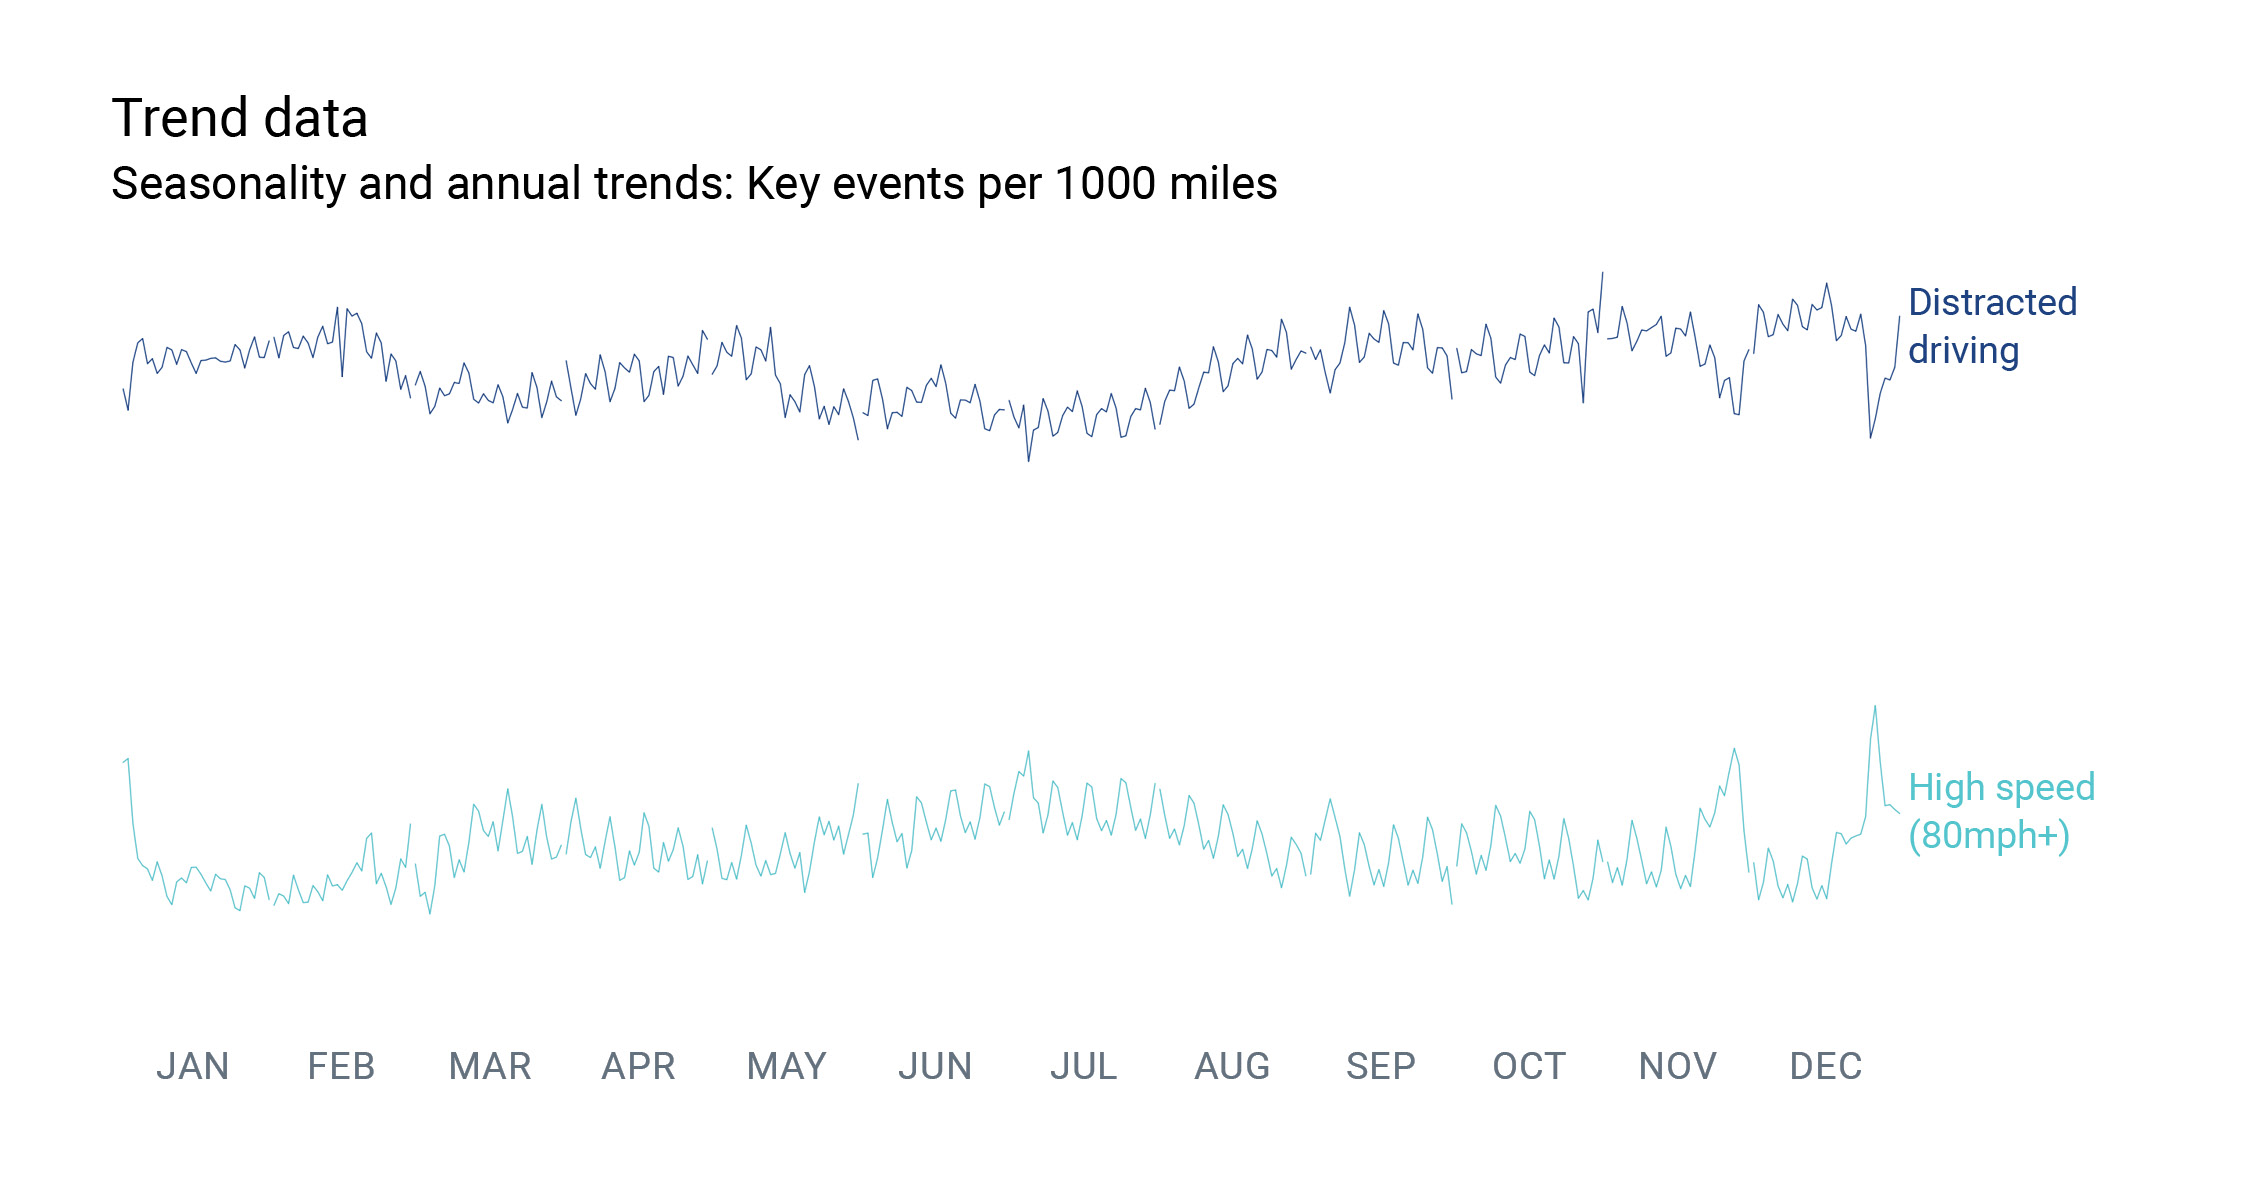
On a national level, rates of distracted driving tend to increase in late fall and early winter when people are driving more slowly, sometimes due to rain or snow.
When we look at rates of distracted driving throughout the week, we see that it increases on days traffic tends to be heavier. So, when people are commuting Monday through Friday, we see higher numbers of distracted driving occurrences.
So, what? We need to know when distracted driving occurs to prevent it.
Higher speeds necessitate more attentive driving. When people drive faster, they focus more, and do less distracted driving.
While we don’t suggest increasing speed limits to curb distracted driving, there are obtainable solutions:
On average, Americans check their phones 96 times a day which is equivalent to once every ten minutes. The problem is this behavior doesn’t necessarily end when someone gets behind the wheel. And, if you take your eyes off the road for five seconds while traveling 55 mph, that’s the equivalent of driving the entire length of a football field with your eyes closed.
Phone handling behind the wheel is a bad habit – and while it may be difficult to quit, it’s absolutely necessary to put an end to this epidemic.
Check out our full report to learn more about our findings and how our driving behavior data and insights help auto insurers, auto aftermarket retailers, vehicle manufacturers and dealers, and DOTs fight distracted driving, making transportation smarter, safer, and more useful for everyone.
Methodology: Our multi-source dataset includes anonymized and aggregated driving behavior data collected through consumer mobile apps and insurance telematics programs. We’re connected to millions of U.S. drivers and have a credible representation in every state and demographic such as families, single vehicles, rural, and cities). While most of the trips we collect are personal trips, Arity can distinguish between personal trips, gig driving, and non-driving impacts.