Mobility data reveals consumer demand shifts when a new grocery store comes to town Read article

While the holidays are known as the happiest time of the year, it can also be one of the most stressful times with traveling being a top contributor to the “holiday blues.” Whether you’re driving to a different state, city, or zip code, it can be a hassle to pack up, load the car, onboard your family, and pick a hopefully safe, low-traffic route.
To help drivers travel smarter and safer, the Arity team looked at our massive driving behavior dataset, which consists of nearly 45M U.S. drivers. We looked at driving insights from 2021 – 2023 to uncover need-to-know trends for your Christmas and New Year’s travel plans. Here’s what we found:
Quick stats!
On Christmas Day:
- High speed (80+) driving increases 28%
- Distracted driving decreases 11%
- Hard braking decreases 24%
On New Year’s Eve:
- High speed (80+) driving increases 10%
- Distracted driving increases 7%
- Hard braking decreases 8%
Percentage changes are compared to the annual averages for the corresponding day of the week.
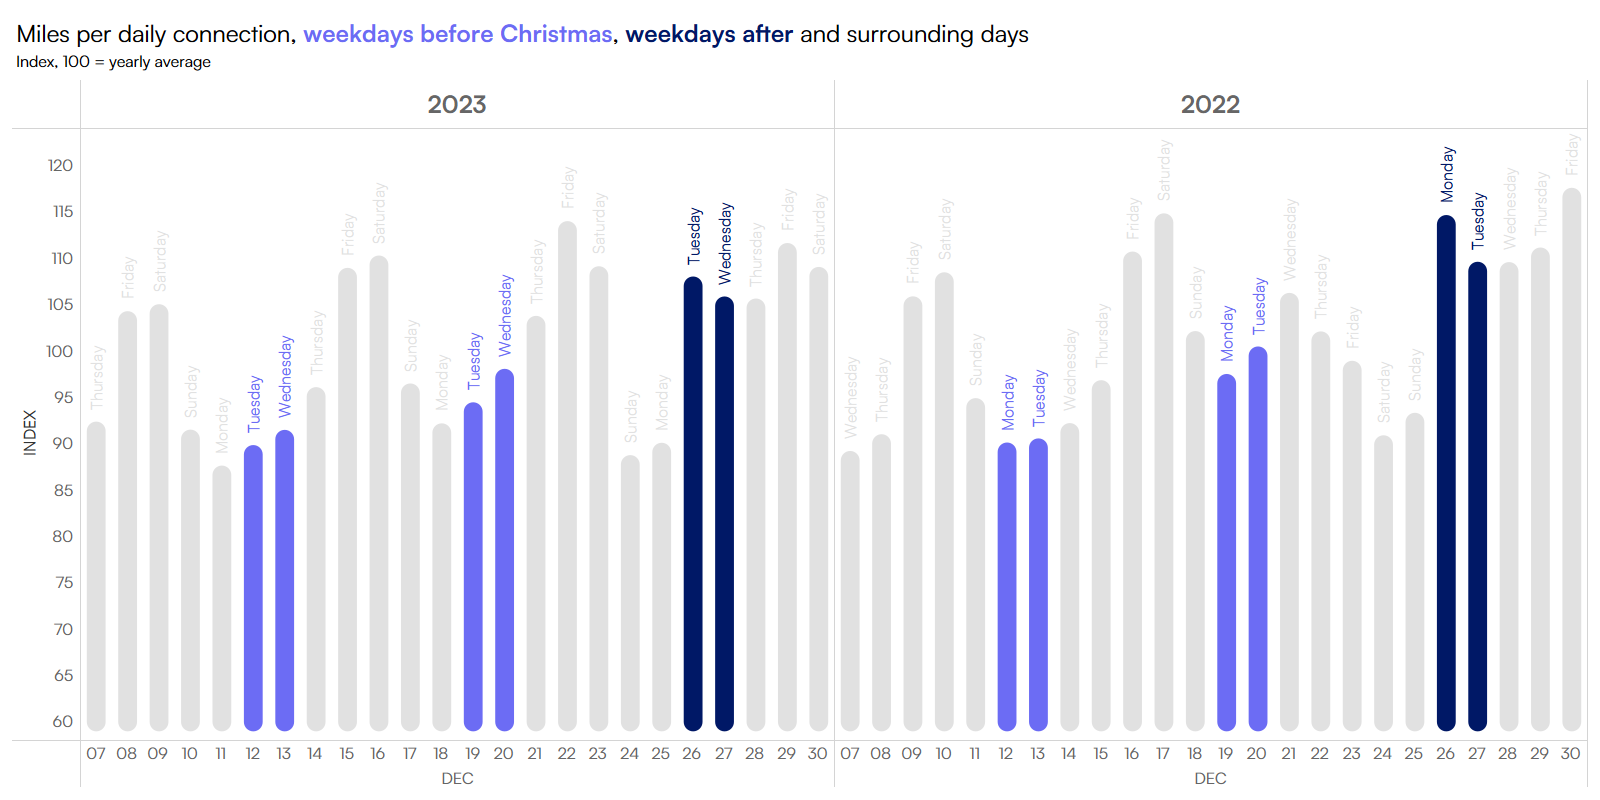
With kids off from school and many professionals taking time off from work, it’s no surprise that Christmas disrupts typical travel patterns. For the last two years, which both had multiple weekdays following Christmas, we saw a notable – more than 10% – increase in miles driven the days following the holiday compared to “normal,” i.e., compared to the annual averages for the corresponding days of the week. With Christmas falling on a Wednesday this year, we expect to see the same.
Takeaway: If you’re planning to avoid traffic during your Christmas travels, keep in mind that it’s heightened the weekdays between Christmas Day and New Year’s Eve. This is likely due to a shift from typical workday travel patterns, with about 52% of companies closed for the holidays.
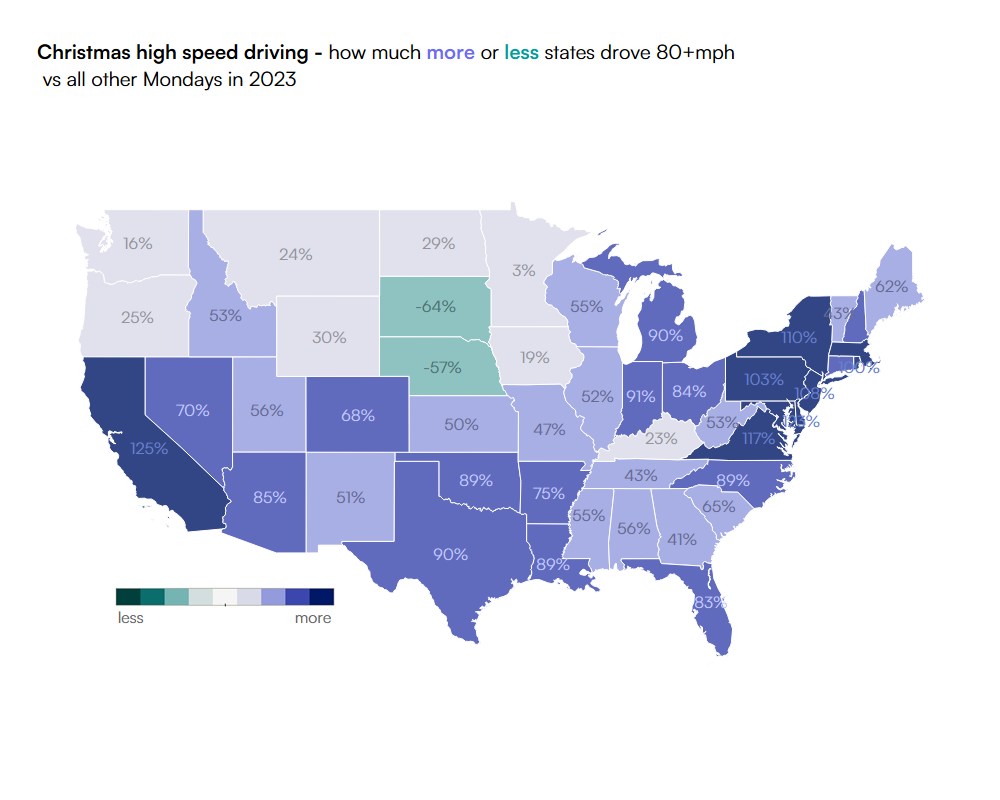
Although there is less travel on Christmas Day, drivers that choose to hit the road tend to travel further and faster. When compared to the surrounding weeks, both trip distance and instances of high-speed driving peak on the holiday itself. This trend holds true for almost every state, with South Dakota and Nebraska being a clear exception.
Takeaway: Even if you’re traveling on low-traffic days, like Christmas Day, it’s important to be cautious of risky driving behaviors like speeding.
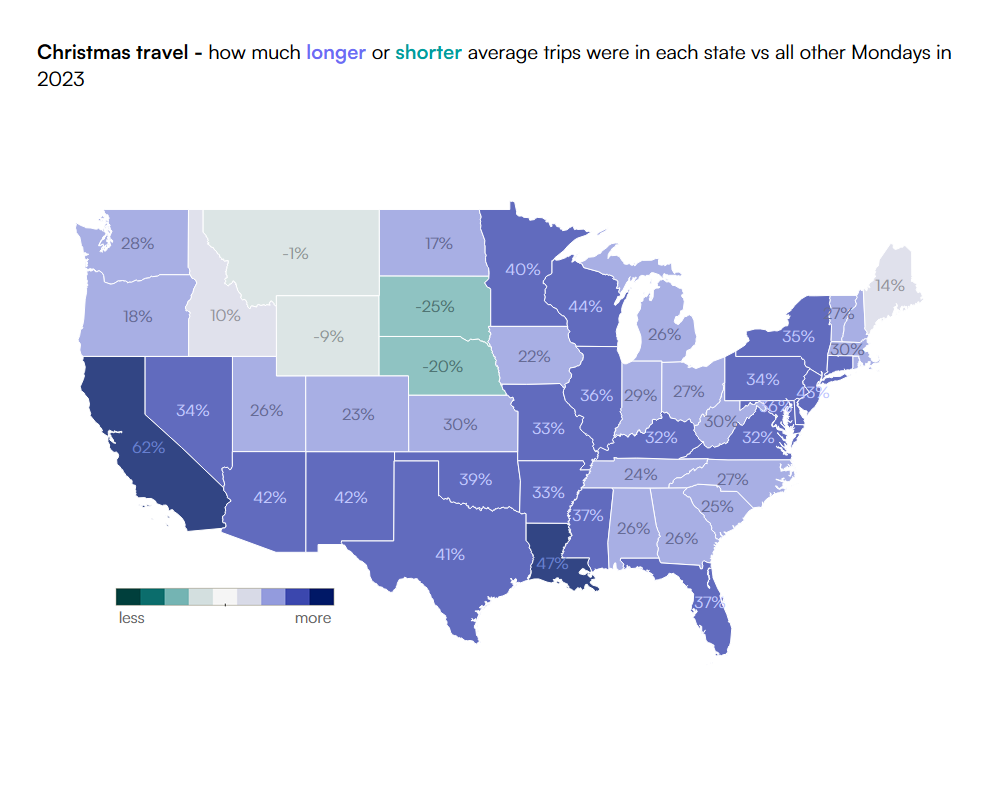
Similar to what we saw for Thanksgiving, travel patterns vary state-by-state. For instance, drivers in South Dakota and Nebraska tend to travel further on Christmas Eve and then stay off the roads on Christmas Day. However, other states like New York and California see the same or more travel on Christmas Day compared to Christmas Eve.
These patterns suggest differences in how people celebrate the holiday, and there may be regional influences. Based on the data, it seems that people in South Dakota and Nebraska travel further and earlier to visit non-local friends and family while others, such as those in New York and California, appear to make more rounds on Christmas Day.
If you would like to avoid traffic and risky driving on Christmas Day, it may be smart to head out in the early morning. Drivers tend to hit the road starting midmorning with peak travel between 12 and 5 p.m. But again, this can vary by state. For example:
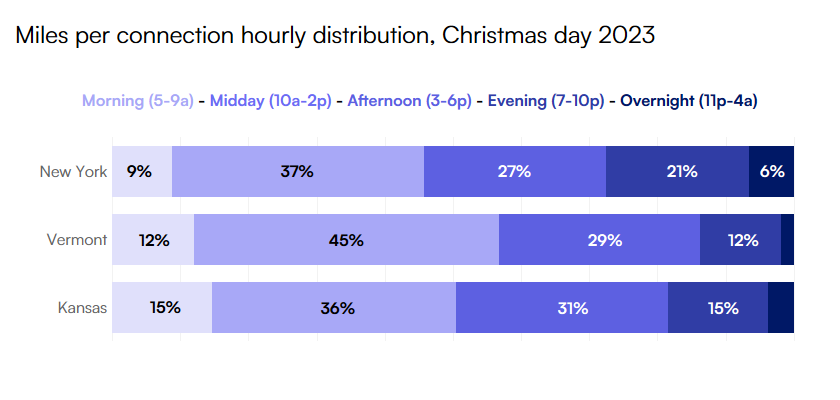
Takeaway: While in general, the early morning is the best time period to hit the road to avoid traffic on Christmas Day, this can vary based on where you live.
As expected, New Year’s Eve dramatically shifts evening and late-night travel patterns across the U.S. as we see traffic heightened, most notably between midnight and 3 a.m., compared to surrounding weeks.
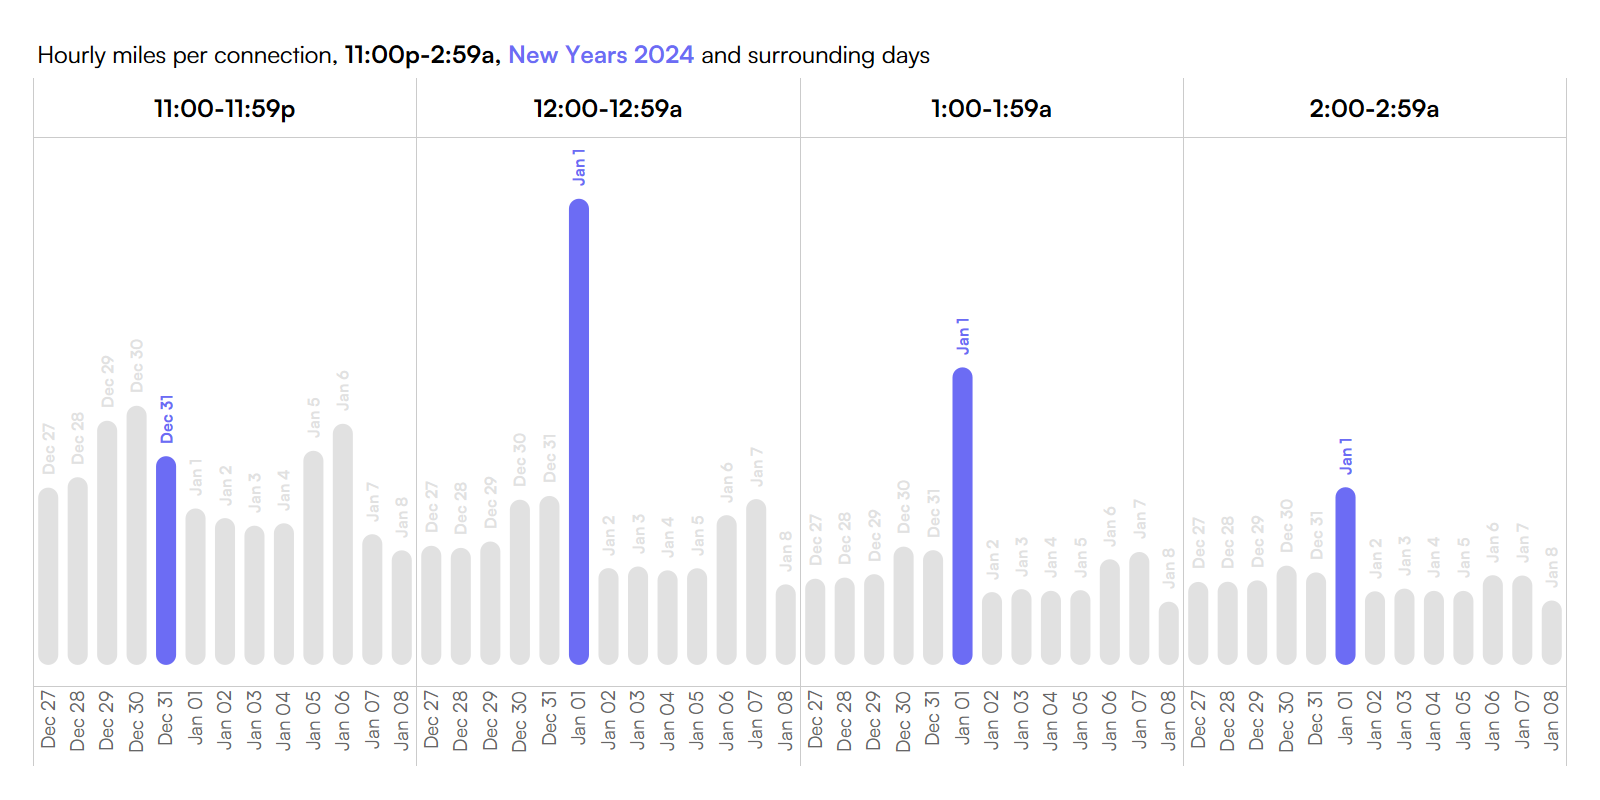
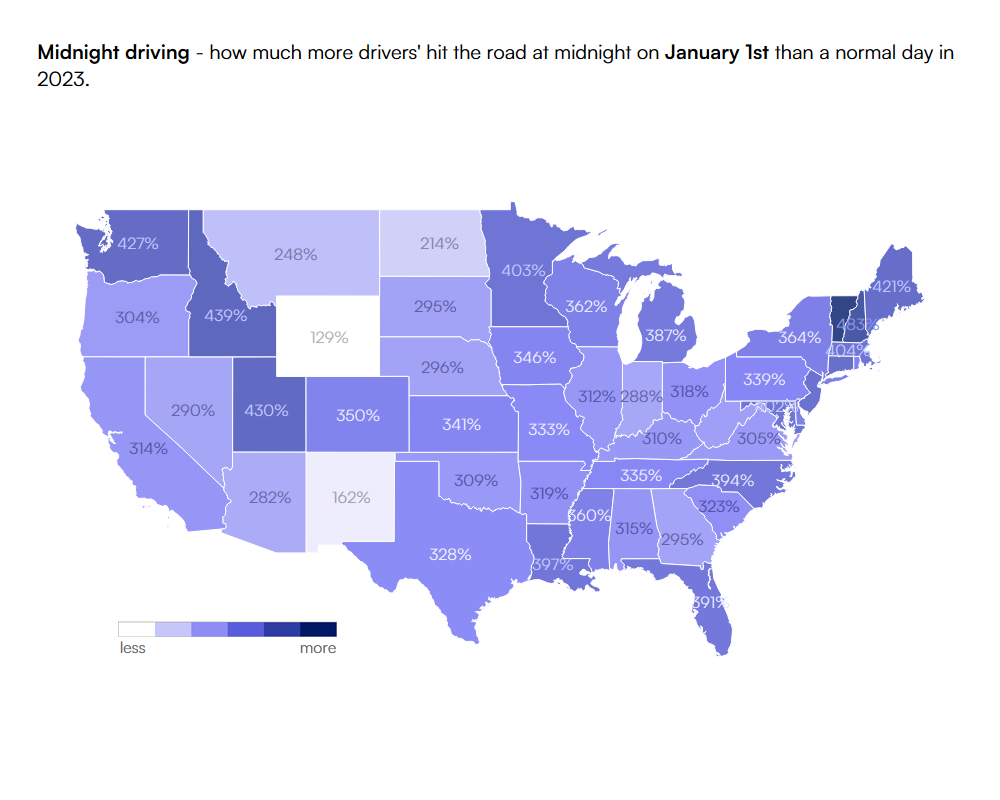
When looking across the U.S., the biggest surge occurs between midnight and 1 a.m. on New Year’s Day with over four times the miles driven compared to normal. In fact, most states see roughly four to five times their normal number of miles driven.
Vermont had the most dramatic increase with six times the miles driven in that same time period. Even Wyoming, which had the smallest increase, saw over twice as many miles driven compared to normal.
Takeaway: If you’re planning to drive late on New Year’s Eve, be prepared for significantly busier roads and be extra cautious.
People are using their phones while driving much more on New Year’s Eve, starting at noon and peaking between 8 p.m. and 1 a.m. Last year, in the hours around midnight, distracted driving was 38% higher than the overall average in 2023 for that time period.
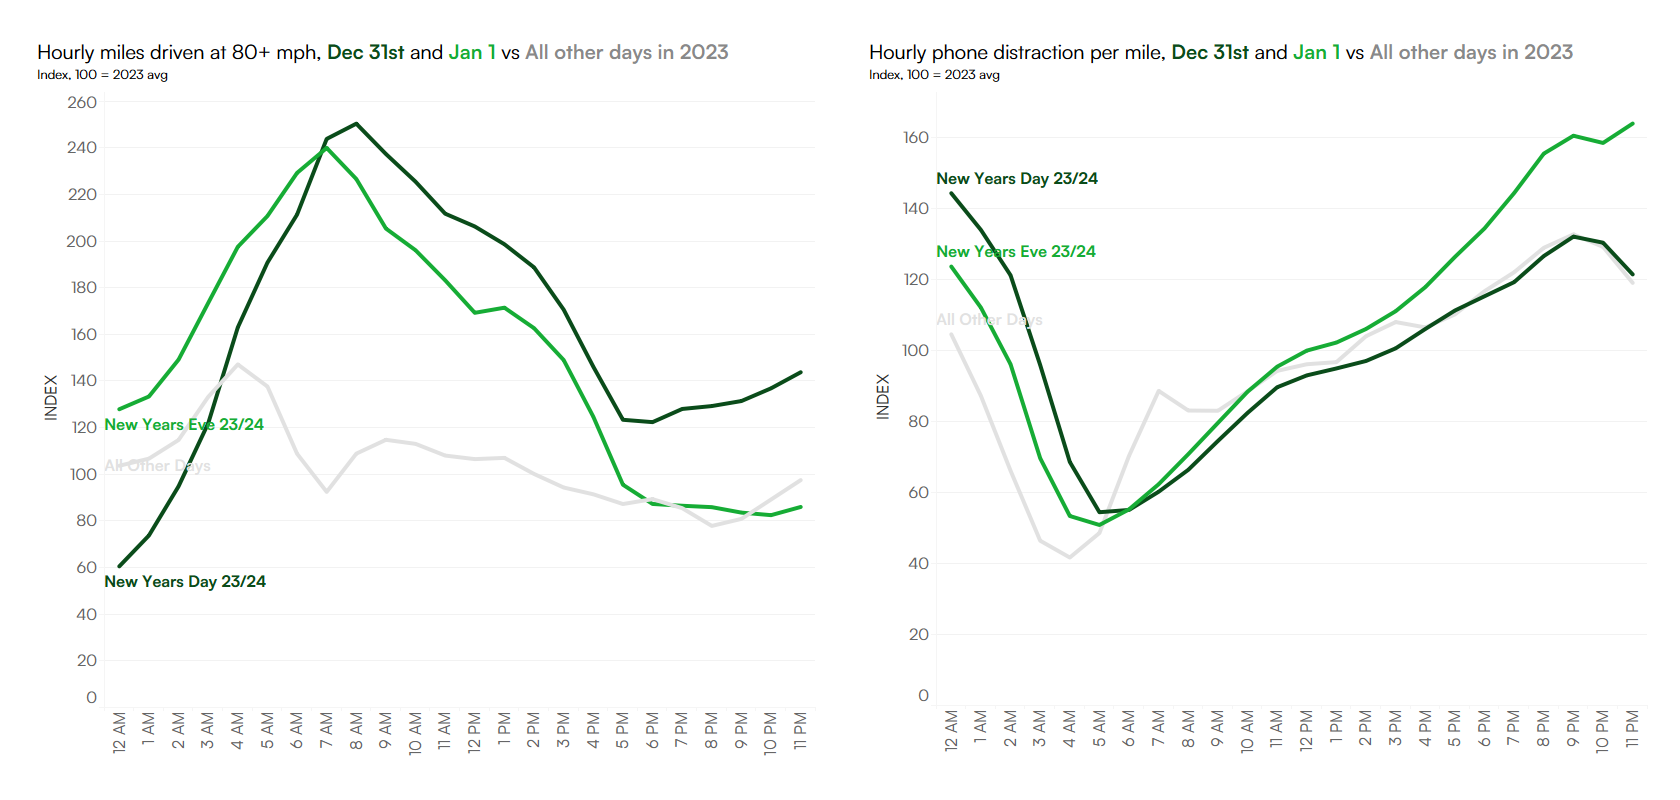
While distracted driving is more prevalent later in the day, high speed driving (80+ mph) is heightened in the morning and afternoon before dropping to normal levels in the evening on New Year’s Eve. Last year, high speed driving was 68% higher compared to the overall 2023 average.
Takeaway: These upticks in risky driving behaviors highlight the importance of staying vigilant on the road throughout the entire day, whether you’re running errands, heading to celebrations, or driving home late at night.
With drivers staying out late on New Year’s Eve, traffic is typically delayed the next morning. While a normal weekday sees traffic increases around 5 a.m., traffic doesn’t start to pick up until between 6 and 7 a.m. on New Year’s Day – and overall volume doesn’t “catch up” to December 31st levels until we get closer to noon.
Takeaway: Less traffic the morning of New Year’s Day means you can enjoy a more relaxed start to 2025. Whether you’re heading home from celebrations or planning a brunch outing, the roads are quieter until closer to noon.
As we say goodbye to 2024, we look forward to another year of turning raw data into predictive insights as holidays, special events, and unexpected incidents alter driving patterns and behaviors in the U.S. For us, it’s all about helping consumers, businesses, and government agencies better navigate these shifts so we can all work towards making transportation smarter, safer, and more useful for everyone.
Ready to learn more about U.S. driving trends? Download our latest data report.
Arity’s multi-source dataset, comprising over 45 million active connections, captures anonymized and aggregated driving behavior data from consumer apps and insurance telematics programs. By drawing from diverse sources beyond any single industry, we provide a comprehensive view of how, where, and when people move across the U.S., with representation across all states and demographics.
Our data distinguishes personal trips from gig driving and non-driving impacts, offering insights into trends like speeding, braking, acceleration, phone handling, and time of day. Supported by the largest telematics dataset linked to auto insurance claims, we can accurately predict the impact of shifting dangerous driving behaviors detailed in this report.